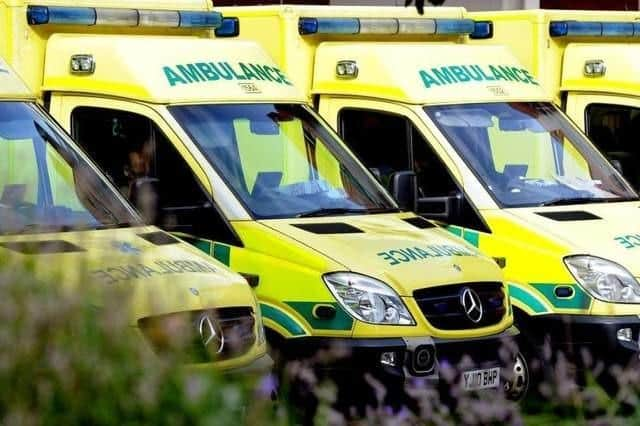
Ambulance waiting time targets for urgent cases not met in South Yorkshire

and live on Freeview channel 276
The figure, which was released by NHS England, indicates that the waiting times are two minutes and 33 seconds greater than the NHS's seven minute response time target.
In comparison to prior years, the current waiting times are the longest.
Advertisement
Hide AdAdvertisement
Hide AdThe average waiting time in 2021 was nine minutes and 16 seconds. In 2020, it was seven minutes and 38 seconds.

Meanwhile, the waiting time in 2019 was seven minutes and 12 seconds, down nine seconds from the prior year.
Nationally, ambulance services are falling short of critical response time targets, with response times for life-threatening conditions (category 1) failing to meet the target in almost a year, while emergency response times (category 2) have not met the target since March of last year.
It has been reported that ambulance crews are dealing with more life threatening incidents such heart attacks (known as category 1 call-outs) than in previous years
Advertisement
Hide AdAdvertisement
Hide AdIn April of this year, these types of calls were at the highest level for the same month since 2018, when current records began, at over 76,500.
They represented 14 per cent of all incidents in comparison to nine per cent in the same month during previous years.
There were nearly 20,000 more life threatening incidents recorded last month compared to in April 2021, and more than 26,000 more than during the height of the coronavirus pandemic in April 2020.
Last year (2021-22) the bulk of incidents were in relation to emergency incidents (category 2), such as strokes or chest pain, which made up 66 per cent of incidents.
Advertisement
Hide AdAdvertisement
Hide AdThe second most common reason was for urgent help (category 3), such as for a burn, and made up 21 per cent of incidents. Life threatening category call-outs made up 12 per cent of incidents, while one per cent of calls were for non-urgent treatment (category 4).
London Ambulance Service records quickest response times
The data also revealed that people requiring medical care waited an average of 32 seconds for their 999 call to be answered last year – six times longer than the year before when the average answering time was five seconds.
There were also 10.6 million calls answered last year, up by 32 per cent on the previous year.
Last month (April) there were 860,000 calls (up 25 per cent in April 2021) which were answered in 28 seconds on average.
Advertisement
Hide AdAdvertisement
Hide AdThe analysis comes after health bosses openly expressed concerns at dangerously long ambulance waiting times across the country.
The data further revealed that South Western Ambulance Service had the longest waiting times in England for life threatening conditions (category 1), taking on average 11 minutes and 45 seconds.
The second worst ambulance service was Isle of Wight Ambulance Service which took 10 minutes 58 seconds to respond, followed by East of England Ambulance Service at 10 minutes 17 seconds.
London Ambulance Service had the quickest response times in England taking six minutes 40 seconds, followed by North East Ambulance Service at seven minutes 16 seconds.