
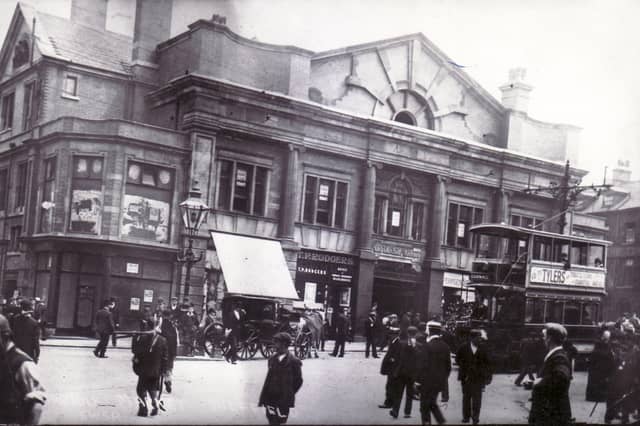


They take you decade by decade from 1851 to 2021, during which time the city’s population more than trebled from 161,475 to 556,500. Norfolk Market Hall, Goodwin Fountain at the top of Fargate, the Royal Hospital on West Street, and Sheaf Market are just some of the lost sights pictured.
This retro photo gallery reveals how the city’s population has changed decade by decade, starting in 1851, with a rapid rise during the steel industry’s boom days followed by a slight decline as the economy suffered a downturn.
Sheffield’s population is again on the rise, according to the latest Census figures, though it remains below its peak in 1951.
Our gallery only starts in 1851, but, according to Sheffield City Council’s data, the population stood at around 150-200 in 1086, 2,200 in 1379, and 3,000 in 1692.
It then started to rise more rapidly, to 5,000 in 1692, 9,695 in 1736, 20,000 in 1750, and 60,095 in 1801.

13. 1971 - 572,794
Sheaf Street and Sheaf Market (Rag 'n' Tag) in 1971, when Sheffield's population was 572,794 | Picture Sheffield/H. Mann Photo: Picture Sheffield/H. Mann
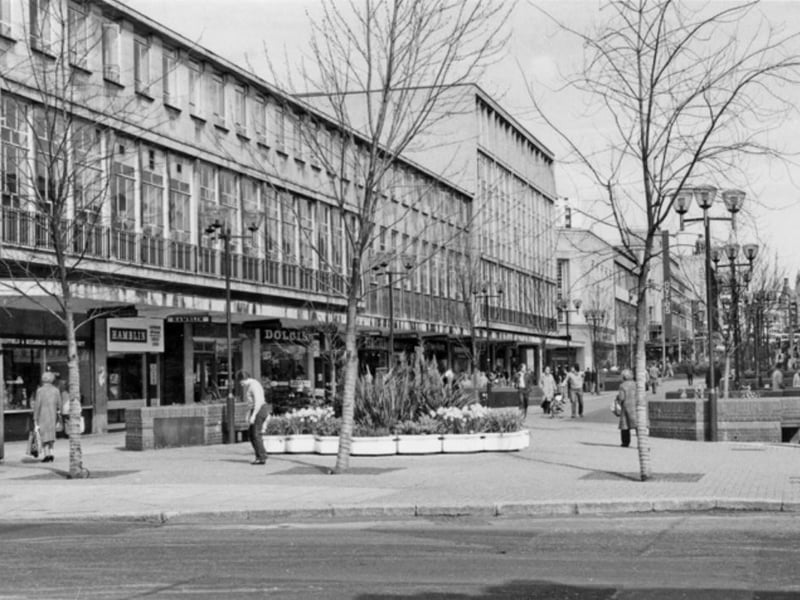
14. 1981 - 530,844
Shops on The Moor in 1981, when Sheffield's population was 530,844 | Picture Sheffield Photo: Picture Sheffield
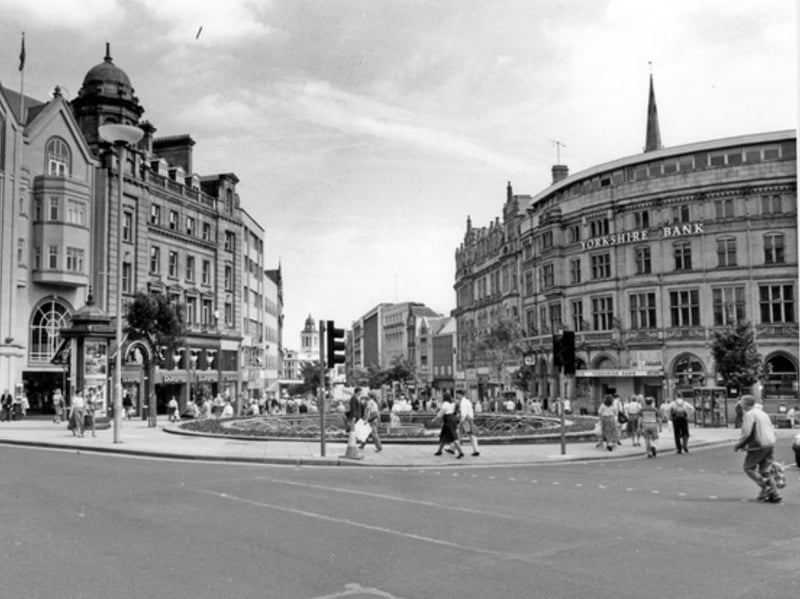
15. 1991 - 528,708
Town Hall Square, looking towards Fargate and the Goodwin Fountain, in 1991, when Sheffield's population was 528,708 | Picture Sheffield Photo: Picture Sheffield
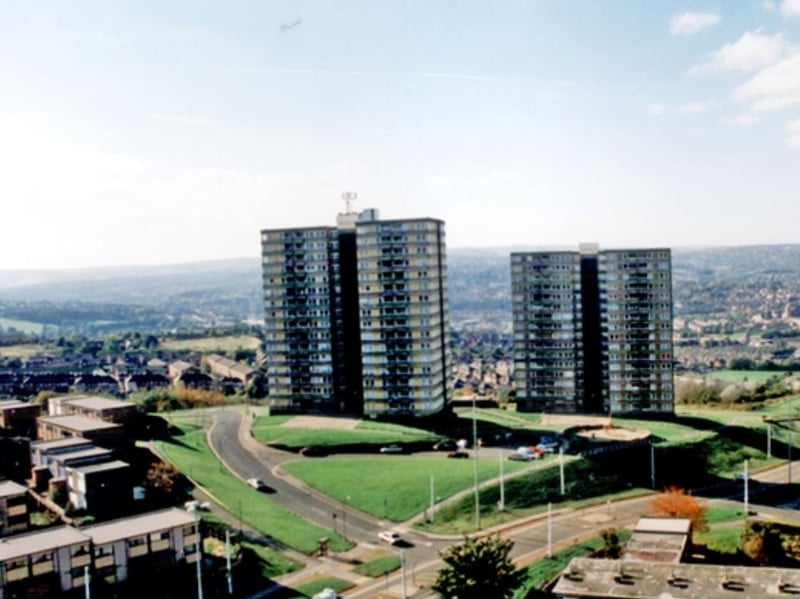
16. 2001 - 513,234
Talbot and Cliffe tower blocks, Kenninghall Mount, Park Grange Road, Norfolk Park, prior to their demolition in 2001. Sheffield's population at the time was 513,234 | Picture Sheffield/Steven Smith Photo: Picture Sheffield/Steven Smith