
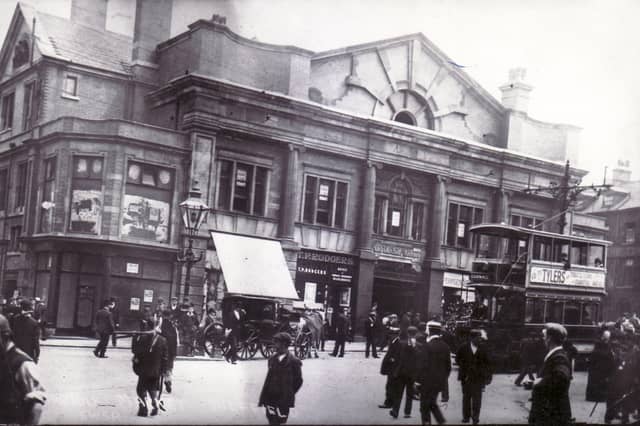


They take you decade by decade from 1851 to 2021, during which time the city’s population more than trebled from 161,475 to 556,500. Norfolk Market Hall, Goodwin Fountain at the top of Fargate, the Royal Hospital on West Street, and Sheaf Market are just some of the lost sights pictured.
This retro photo gallery reveals how the city’s population has changed decade by decade, starting in 1851, with a rapid rise during the steel industry’s boom days followed by a slight decline as the economy suffered a downturn.
Sheffield’s population is again on the rise, according to the latest Census figures, though it remains below its peak in 1951.
Our gallery only starts in 1851, but, according to Sheffield City Council’s data, the population stood at around 150-200 in 1086, 2,200 in 1379, and 3,000 in 1692.
It then started to rise more rapidly, to 5,000 in 1692, 9,695 in 1736, 20,000 in 1750, and 60,095 in 1801.
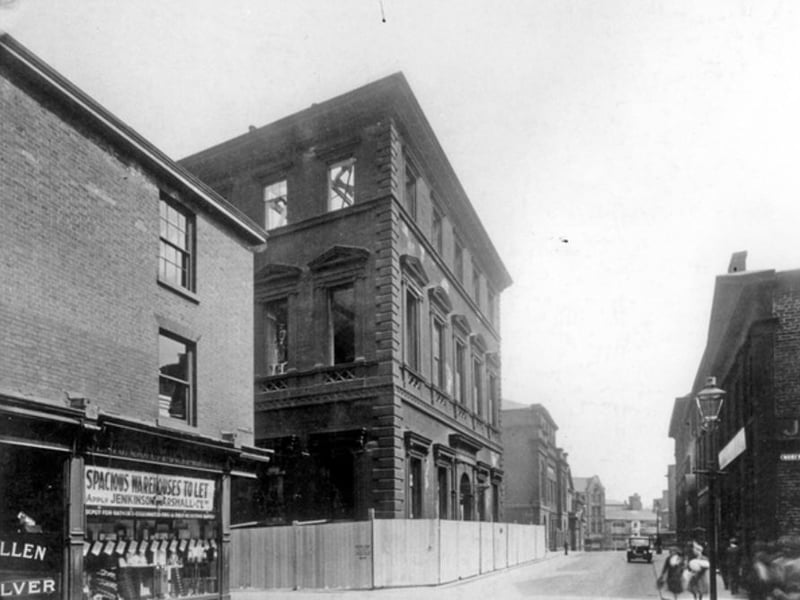
9. 1931 - 562,822
This photo from 1931 shows the demolition of the former Mechanics' Institute and old Central Library, on Surrey Street, at the junction with Tudor Street, in preparation for the new Central Library. Sheffield's population that year was 562,822 | Picture Sheffield Photo: Picture Sheffield
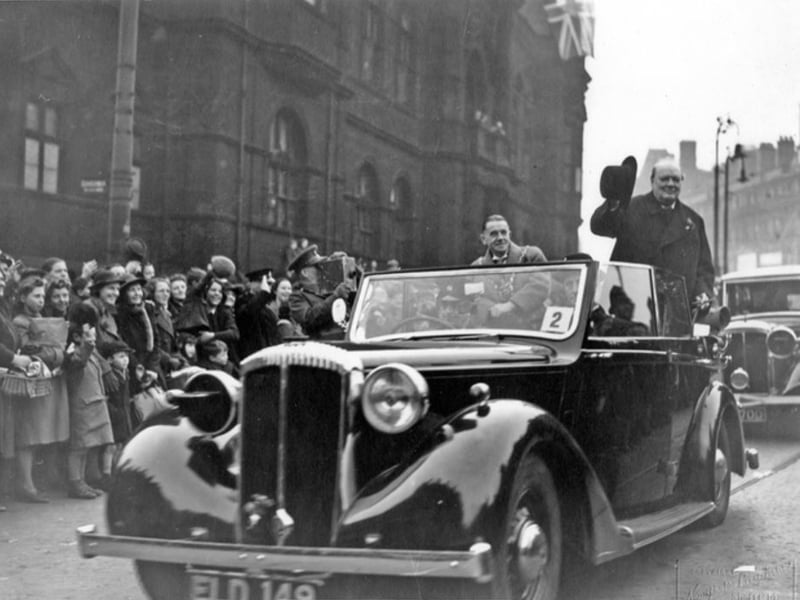
10. 1941 - 569,884
Winston Churchill visits Sheffield in 1941, when the city's population was 569,884 | Picture Sheffield/Newsphotos Press Agency Photo: Picture Sheffield/Newsphotos Press Agency
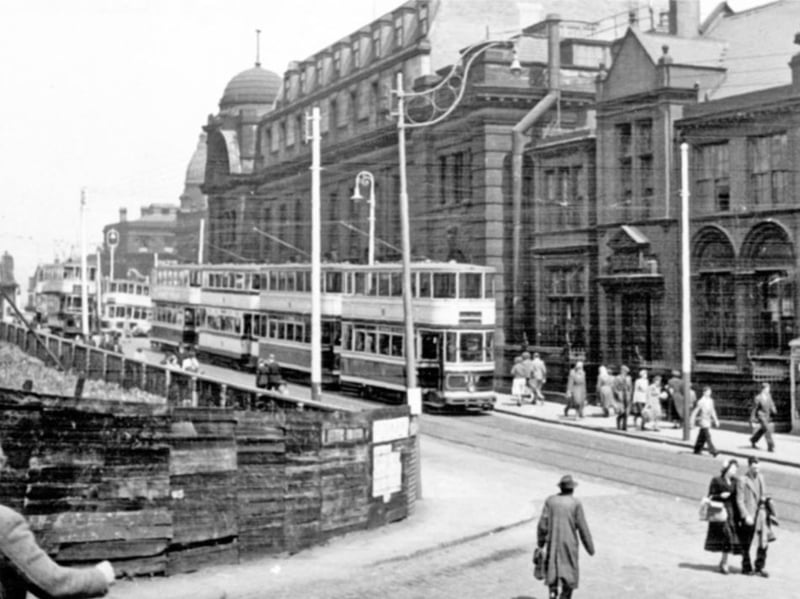
11. 1951 - 577,050
Flat Street, Sheffield, in 1951, when the city's population stood at 577,050 | Picture Sheffield Photo: Picture Sheffield
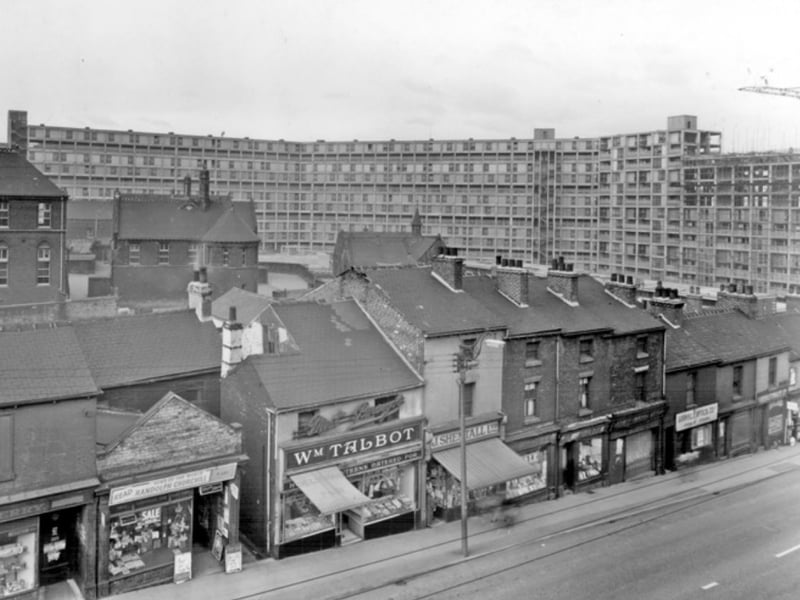
12. 1961 - 574,915
Duke Street, Sheffield, with the Park Hill flats in the background, in 1961. The city's population that year was 574,915 | Picture Sheffield Photo: Picture Sheffield