

Boris Johnson has confirmed that Step Four of the Government's road map out of lockdown will go ahead as planned next Monday.
Nightclubs will be encouraged to use vaccine passports for entry, while face masks will be ‘expected and recommended’ on public transport.
It comes as case rates continue to rise across most of the country, including in Sheffield.
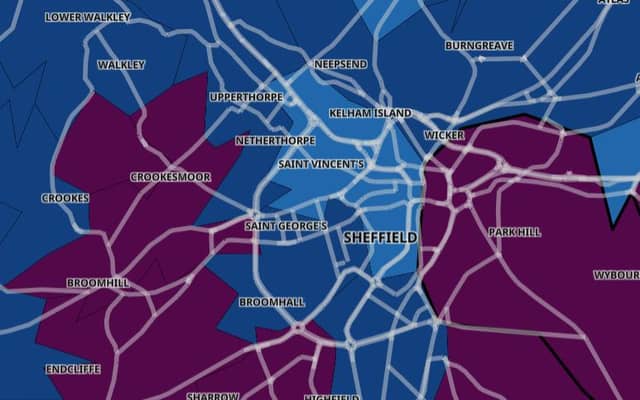
Sheffield’s Covid rate for the seven days to July 7 stands at 338.5 new cases per 100,000 people.
That’s up from 238.2 for the previous week and is higher than the latest UK-wide rate of 311.7.
As the country prepares to lift restrictions, we reveal which Sheffield neighbourhoods recorded the highest infection rate between July 1 and July 7, the latest date for which figures are available.
All images are for illustrative purposes only.
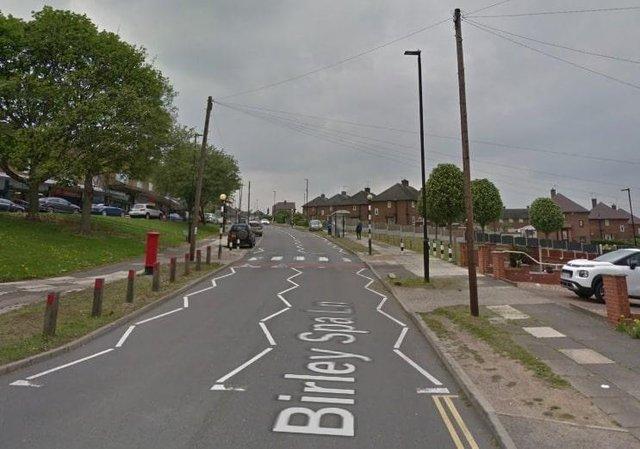
5. Birley
Birley recorded 63 new cases in the seven days to July 7. That’s a rate of 570.2 new cases per 100,000 population, which is up by 142.3% from the previous week Photo: Google Maps
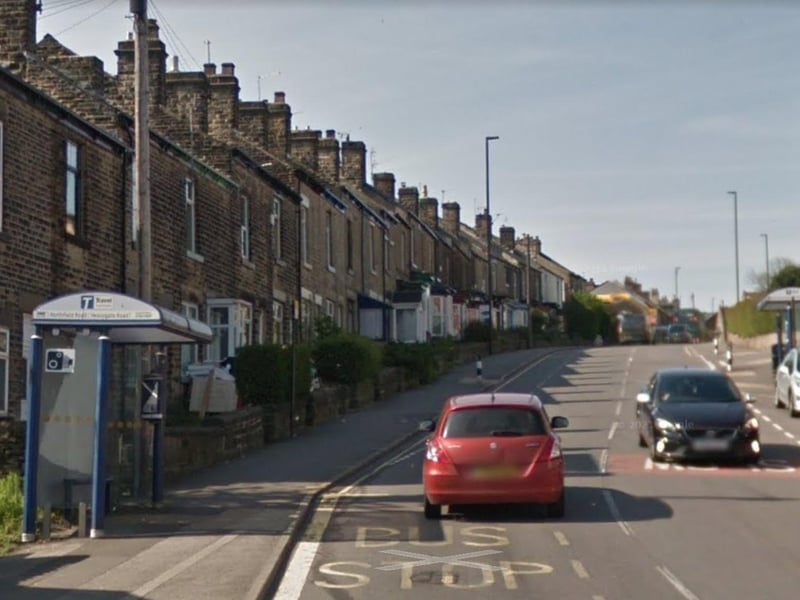
6. Springvale and Steel Bank
Springvale and Steel Bank recorded 33 new cases in the seven days to July 7. That’s a rate of 542.7 new cases per 100,000 population, which is down by 25% from the previous week Photo: Google Maps
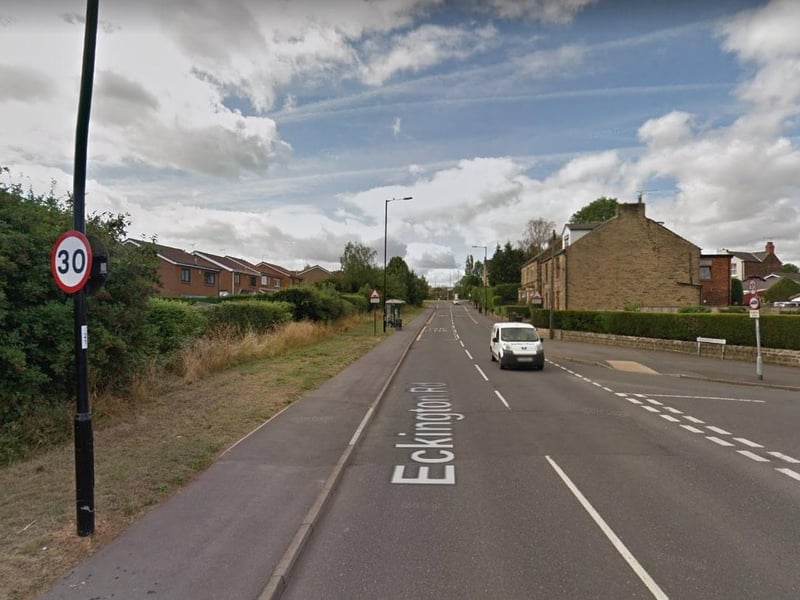
7. Sothall
Sothall recorded 27 new cases in the seven days to July 7. That’s a rate of 512.3 new cases per 100,000 population, which is up by 42.1% from the previous week Photo: Google
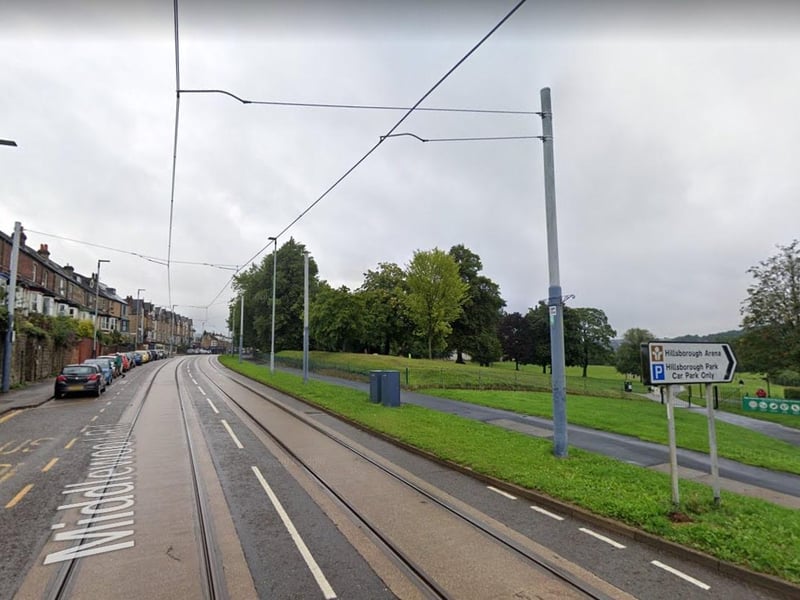
8. Hillsborough, Owlerton and Wadsley Bridge
Hillsborough, Owlerton and Wadsley Bridge recorded 31 new cases in the seven days to July 7. That’s a rate of 507.8 new cases per 100,000 population, which is up by 55% from the previous week Photo: Google