

In the figures, the city is broken down into different neighbourhoods such as Parson Cross and Arbourthorne.
It shows the number of cases recorded in the seven days to August 26 and how high the rate per 100,000 is.
These are the 12 neighbourhoods in the local authority area with the highest Covid rates in the week leading to August 26.
The case rate for England as a whole during this period was 315.2 and Sheffield’s whole rate was 313.8.
In some areas, the number of cases recorded may have fallen from the previous week, however the infection rate is still higher in these areas than in other parts of Sheffield - and the national average. Is your area on the list?
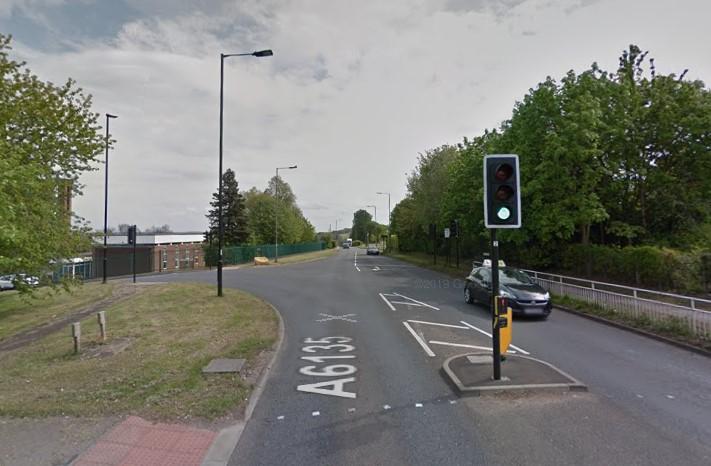
1. Birley
The infection rate in the week to August 26 was 624.5 per 100,000. Cases were up 32.7 per cent compared to the week before. Photo: Google Maps
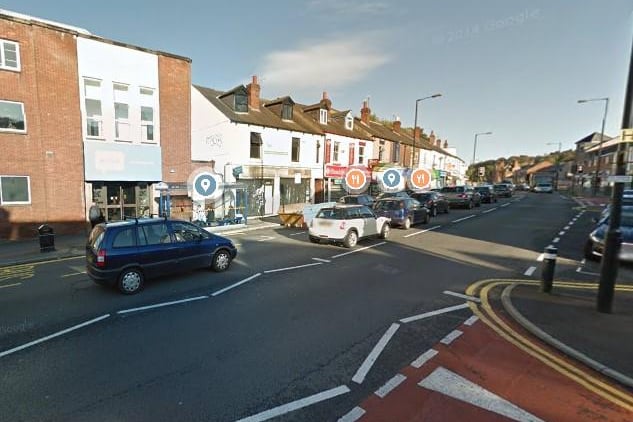
2. Woodseats
The infection rate in the week to August 26 was 580.0 per 100,000. Cases were up 12.8 per cent compared to the week before. Photo: Google Maps
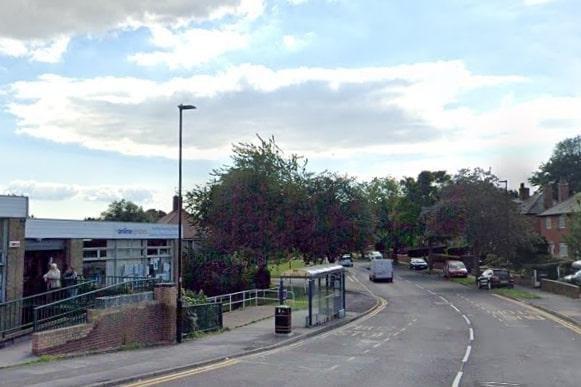
3. Southey Green East
The infection rate in the week to August 26 was 534.6 per 100,000. Cases were down 28.8 per cent compared to the week before. Photo: Google Maps
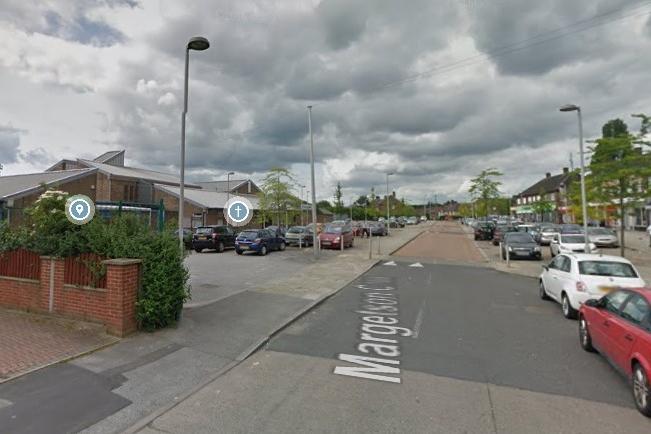
4. Parson Cross
The infection rate in the week to August 26 was 523.7 per 100,000. Cases were up 10.9 per cent compared to the week before. Photo: Google Maps