

Prime Minister Boris Johnson this week announced new restrictions coming into force across England, with people being advised to work from home where possible, face masks required in most indoor venues and Covid passes or proof of a negative test needed to access large venues.
The measures are being introduced in an effort to halt the spread of the Omicron variant, and there are already rumours that restrictions could be further tightened under ‘Plan C’ should the new rules not prove sufficient.
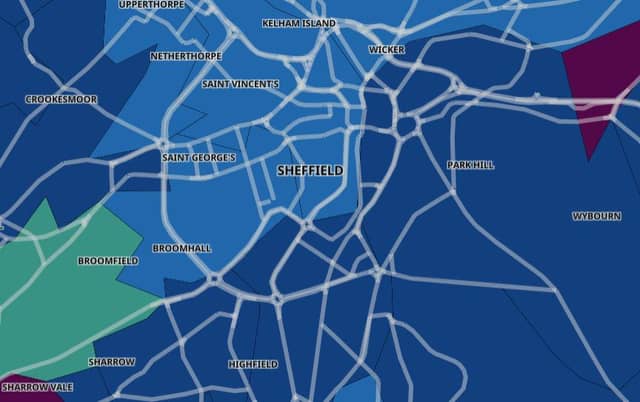
The latest data shows that Sheffield had a Covid-19 case rate of 304 per 100,000 people in the seven days to December 4, with 1,791 new confirmed cases being recorded during that week.
How many people have Covid in Sheffield and how many are in hospital?
That is well below the England-wide rate of 503.8.
As of December 7, the number of Covid patients in Sheffield’s hospitals stood at 86, which is well down from 146 at the end of October.
Malin Bridge & Wisewood was the worst affected area of Sheffield, with a Covid-19 case rate of 767.2.
Data for the last five days is not included as it may not yet be complete or accurate.
Here we reveal the areas of Sheffield that had the highest Covid-19 case rates per 100,000 people in the seven days leading up to December 4.
- RELATED: "Strokely Come Dancing" returns to Sheffield after 10 years
- RELATED: Why Sheffield fruit fly population is surging in autumn - and what to do about them
- RELATED: Tiny white flies swarm Sheffield - this is why
- RELATED: 'Is Andy Burnham's dream of decent care for elderly so terrifying?' - Nancy Fielder
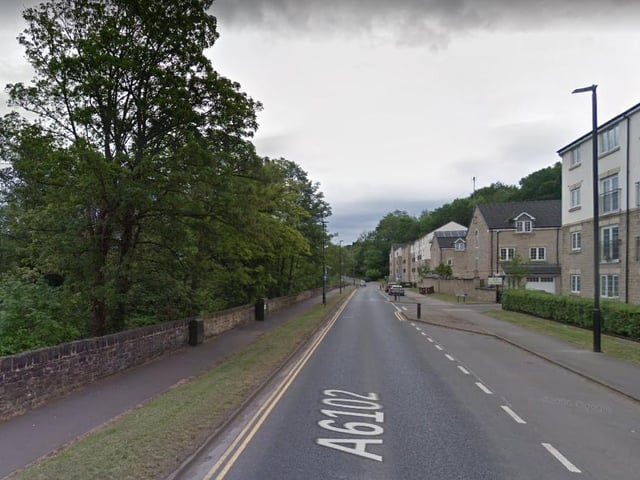
5. Oughtibridge & Bradfield
In the seven days up to December 4, Oughtibridge & Bradfield recorded a Covid case rate of 551.6 per 100,000 people - a rise of 10.2% from the previous week Photo: Google
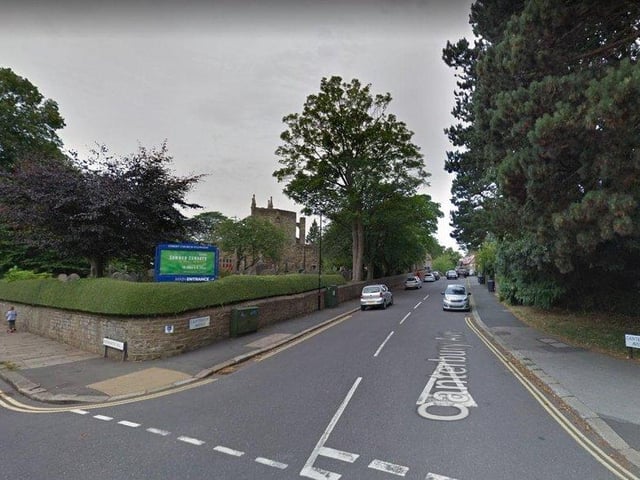
6. Fulwood & Lodge Moor
In the seven days up to December 4, Fulwood & Lodge Moor recorded a Covid case rate of 535.6 per 100,000 people - a rise of 40% from the previous week Photo: Google
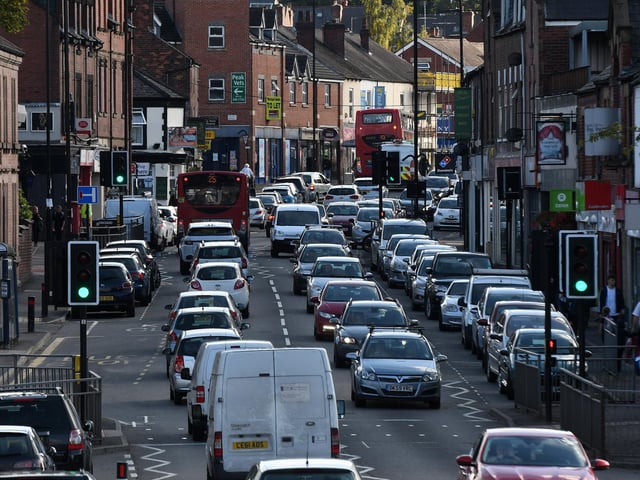
7. Woodseats
In the seven days up to December 4, Woodseats recorded a Covid case rate of 523.6 per 100,000 people - a rise of 53.8% from the previous week Photo: Andrew Roe
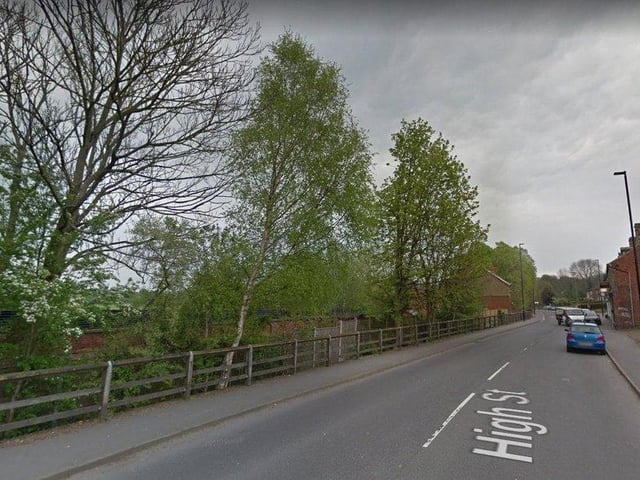
8. Beighton
In the seven days up to December 4, Beighton recorded a Covid case rate of 473.7 per 100,000 people - a rise of 64.7% from the previous week Photo: Google Maps