The 58 places in England in Tier 2 with higher infection rates than Sheffield
and live on Freeview channel 276
Other areas of the country, including most of London, were moved into a newly created higher Tier 4, where household mixing indoors is completely banned over Christmas, and the festive grace period between December 23 and 27 was abolished nationwide.
It is now only permitted to mix households in areas in Tier 3 or below during Christmas day.
Advertisement
Hide AdAdvertisement
Hide AdSheffield’s director for public health Greg Fell has said that pressure on Sheffield’s hospitals remains high, and the infection rate has been rising in recent weeks, which is why it remains in Tier 3.
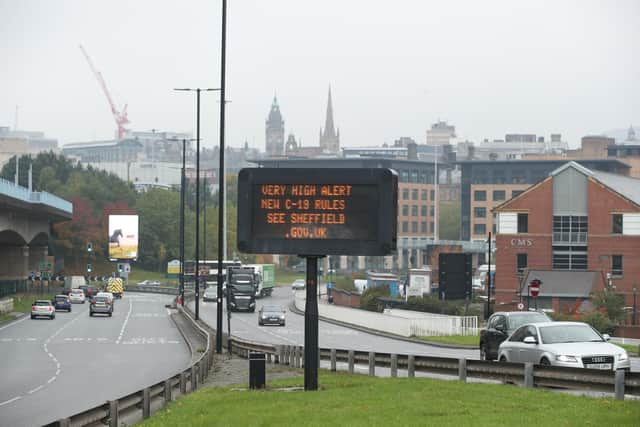

The current infection rate for Sheffield is 154.2 for the week to December 17, meaning there were 902 new cases reported that week.
This is up from 138.5 the week before, reflecting 810 new cases.
The Tier an area is placed into is based on a number of factors. One of these is the infection rate.
Advertisement
Hide AdAdvertisement
Hide AdOthers include: case detection rate - in particular among the over-60s; how quickly case rates are rising or falling; positivity in the general population; pressure on the NHS - including current and projected capacity; and local contexts such as an outbreak.
Because of these various factors, some areas with higher infection rates than Sheffield have been placed in a lower Tier.
The following places in England are in Tier 2 but have higher infection rates than Sheffield.
The rate is expressed as the number of new cases per 100,000 people.
Advertisement
Hide AdAdvertisement
Hide AdData for the most recent four days (December 18-21) has been excluded as it is incomplete and does not reflect the true number of cases.
Of the 315 local areas in England, 284 (90%) have seen a rise in case rates, 30 (10%) have seen a fall and one is unchanged.
From left to right, it reads: name of local authority; the tier of Covid-19 restrictions in which the local authority is currently placed; rate of new cases in the seven days to December 17; number (in brackets) of new cases recorded in the seven days to December 17; rate of new cases in the seven days to December 10; number (in brackets) of new cases recorded in the seven days to December 10.
Rushmoor, Tier 2, 378.4, (358), 173.4, (164)
Wealden, Tier 2, 322.7, (521), 137.5, (222)
Uttlesford, Tier 2, 313.3, (286), 140.2, (128)
Cherwell, Tier 2, 285.0, (429), 126.9, (191)
Eastbourne, Tier 2, 279.5, (290), 99.3, (103)
Northampton, Tier 2, 270.7, (608), 214.6, (482)
Mid Sussex, Tier 2, 267.5, (404), 113.2, (171)
Oxford, Tier 2, 267.0, (407), 166.6, (254)
Scarborough, Tier 2, 259.3, (282), 159.1, (173)
South Northamptonshire, Tier 2, 250.8, (237), 127.0, (120)
Colchester, Tier 2, 249.1, (485), 103.2, (201)
Eden, Tier 2, 246.0, (131), 108.9, (58)
Lewes, Tier 2, 246.0, (254), 75.5, (78)
Ipswich, Tier 2, 242.5, (332), 198.7, (272)
Wellingborough, Tier 2, 242.1, (193), 146.8, (117)
Warrington, Tier 2, 232.4, (488), 140.0, (294)
Babergh, Tier 2, 231.4, (213), 89.1, (82)
Gloucester, Tier 2, 230.0, (297), 223.8, (289)
Tendring, Tier 2, 224.5, (329), 105.1, (154)
Crawley, Tier 2, 218.8, (246), 115.6, (130)
Adur, Tier 2, 213.1, (137), 79.3, (51)
South Cambridgeshire, Tier 2, 212.5, (338), 83.6, (133)
Arun, Tier 2, 210.9, (339), 101.4, (163)
King’s Lynn and West Norfolk, Tier 2, 208.7, (316), 128.8, (195)
Broadland, Tier 2, 208.0, (272), 123.1, (161)
Waverley, Tier 2, 207.4, (262), 118.7, (150)
Brighton and Hove, Tier 2, 206.3, (600), 81.1, (236)
Redditch, Tier 2, 205.3, (175), 118.5, (101)
Advertisement
Hide AdAdvertisement
Hide AdCheshire West and Chester, Tier 2, 203.5, (698), 111.9, (384)
Norwich, Tier 2, 203.5, (286), 130.9, (184)
Hart, Tier 2, 200.9, (195), 107.1, (104)
Great Yarmouth, Tier 2, 199.3, (198), 153.0, (152)
Forest of Dean, Tier 2, 198.2, (172), 186.7, (162)
Cambridge, Tier 2, 195.5, (244), 83.3, (104)
Fenland, Tier 2, 191.5, (195), 124.7, (127)
South Lakeland, Tier 2, 184.6, (194), 116.1, (122)
North Devon, Tier 2, 182.2, (177), 122.5, (119)
Swindon, Tier 2, 178.2, (396), 112.5, (250)
West Suffolk, Tier 2, 178.2, (319), 64.8, (116)
Mid Suffolk, Tier 2, 176.1, (183), 60.6, (63)
Carlisle, Tier 2, 174.8, (190), 104.0, (113)
Southampton, Tier 2, 171.5, (433), 82.8, (209)
Bromsgrove, Tier 2, 171.2, (171), 224.3, (224)
Fareham, Tier 2, 168.6, (196), 98.9, (115)
West Devon, Tier 2, 168.5, (94), 75.3, (42)
Wyre Forest, Tier 2, 166.8, (169), 118.5, (120)
Cheshire East, Tier 2, 165.0, (634), 113.0, (434)
South Oxfordshire, Tier 2, 164.7, (234), 106.3, (151)
East Hampshire, Tier 2, 164.3, (201), 76.9, (94)
Daventry, Tier 2, 164.0, (141), 96.6, (83)
Halton, Tier 2, 163.8, (212), 127.5, (165)
Vale of White Horse, Tier 2, 163.2, (222), 83.1, (113)
West Oxfordshire, Tier 2, 161.8, (179), 74.1, (82)
Somerset West and Taunton, Tier 2, 161.2, (250), 81.2, (126)
Wychavon, Tier 2, 160.7, (208), 87.3, (113)
Sedgemoor, Tier 2, 155.9, (192), 114.5, (141)
Winchester, Tier 2, 155.4, (194), 53.7, (67)
East Northamptonshire, Tier 2, 154.5, (146), 134.4, (127)