

The average house price rose in 51 out of 71 neighbourhoods across the city, new statistics show, with prices falling in 19 areas and no change in the other neighbourhood.
Overall, house prices in Sheffield rose by 6.4 per cent in the year to September 2020, compared with the previous 12 months, with the average house in the city now worth £208,171.
That was the joint 29th biggest price increase out of 336 local authorities in England and Wales, well above the national average rise of 4.1 per cent, according to latest figures from the Office for National Statistics.
However, the number of houses swapping hands in Sheffield fell by 24.9 per cent year on year, to 5,552, in line with the picture across the rest of England and Wales.
The ONS house price figures are broken down by neighbourhood, or, to be precise, Middle Layer Super Output Areas (MSOAs) – small geographic areas containing an average of 7,200 people.
Here we reveal which neighbourhoods in Sheffield saw the strongest growth in the year to September 2020.
![The biggest price hike was in Highfield & Lowfield, where the average price rose to £170,440, up by 53.9 per cent on the year to September 2019. Overall, 63 houses changed hands here between October 2019 and September 2020, a drop of 72 per cent].](https://www.thestar.co.uk/webimg/b25lY21zOjI4YTgzZDc2LTg1MmItNGY2OC1iODEwLWE5YzM0Yzg0NWY1ODpmMThhN2FhYy01YjJkLTQ2MmQtYjljNi03MzBhMjZlOTM3OWM=.jpg?crop=3:2&width=800)
1. Highfield & Lowfield
The biggest price hike was in Highfield & Lowfield, where the average price rose to £170,440, up by 53.9 per cent on the year to September 2019. Overall, 63 houses changed hands here between October 2019 and September 2020, a drop of 72 per cent]. Photo: Google Maps
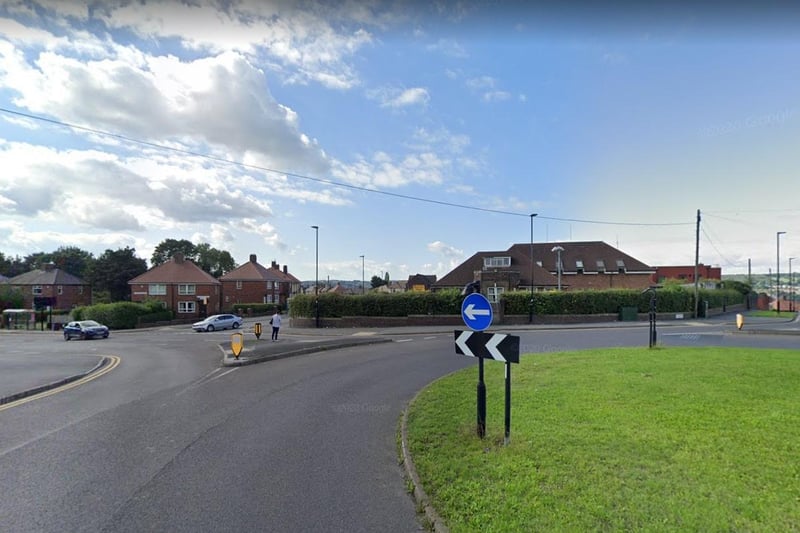
2. Southey Green East
The second biggest price hike was in Southey Green East, where the average price rose to £114,547, up by 25.8 per cent on the year to September 2019. Overall,35 houses changed hands here between October 2019 and September 2020, a drop of 24 per cent. Photo: Google
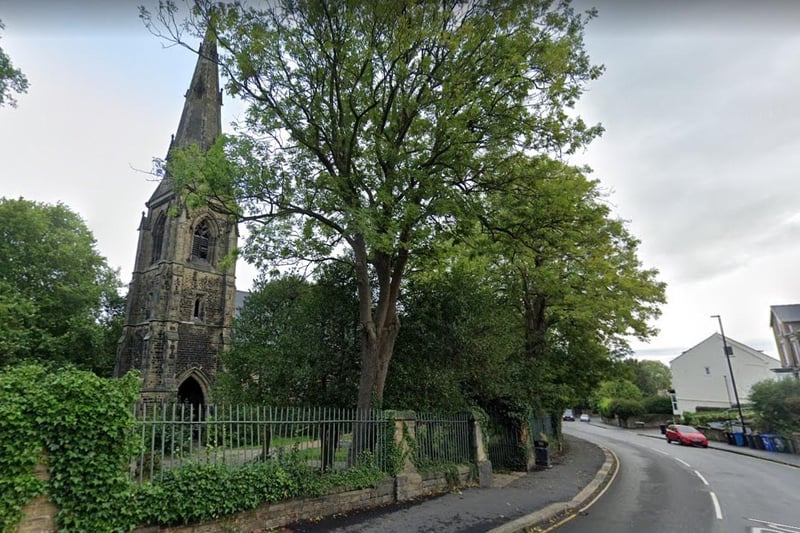
3. Sharrow
The third biggest price hike was in Sharrow, where the average price rose to £208,274, up by 24.1 per cent on the year to September 2019. Overall, 52 houses changed hands here between October 2019 and September 2020, the same number as in the previous 12 months. Photo: Google
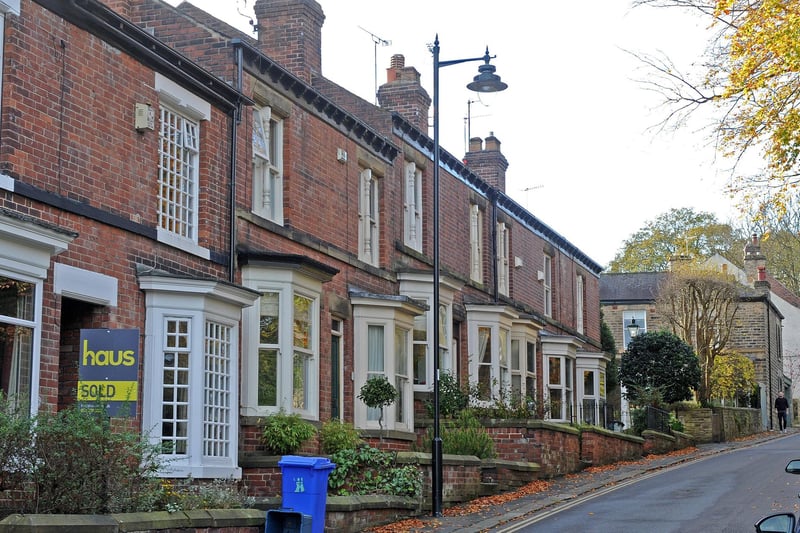
4. Endcliffe & Ranmoor
The fourth biggest price hike was in Endcliffe & Ranmoor, where the average price rose to £439,635 up by 21.3 per cent on the year to September 2019. Overall, 97 houses changed hands here between October 2019 and September 2020, the same number as in the previous 12 months. Photo: Andrew Roe