


The Blades never really looked like getting out of their relegation scrap, and will return to the Championship next term.
In total United picked up 23 points, scoring 20 goals and conceding 63 – but how should they have fared in 2020/21?
Expected goals, or xG for short, is a metric used to determine how many time a side should score over the course of 90 minutes based on the quality of chances they create.
Of course that also means that there is a tally of expected goals conceded, and using these two figures, it’s possible to determine how many points a team is expected to take from a match.
Stats-based site Understat have thrown all of those numbers together, and the outcome is an alternative Premier League table showing where every club should have finished.
Click through the standings below...
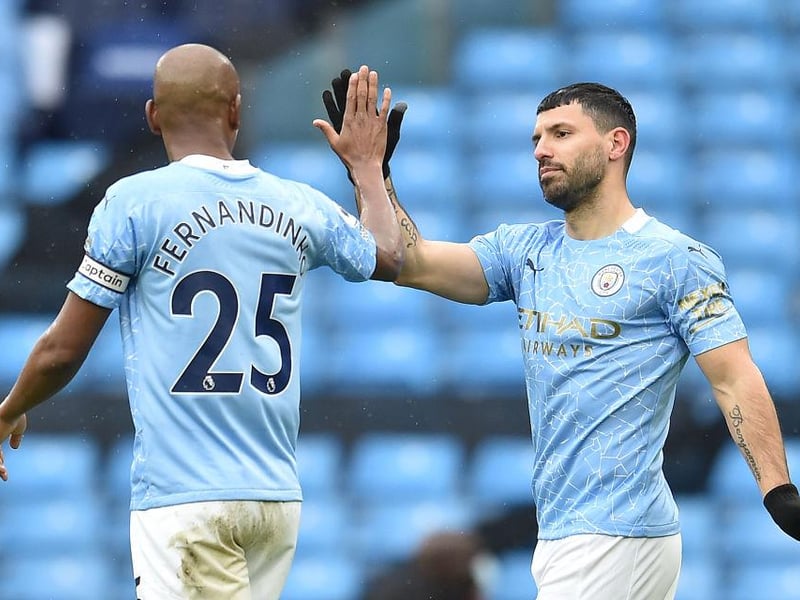
1. Manchester City
Actual League Position: 1st Goals For: 83 Goals Against: 32 Points: 86 xLP: 1st (=) xGF: 77.72 xGA: 30.61 xP: 83.38 (Photo by Peter Powell - Pool/Getty Images) Photo: Pool

2. Chelsea
Actual League Position: 4th Goals For: 58 Goals Against: 38 Points: 67 xLP: 2nd (+2) xGF: 68.66 xGA: 30.9 xP: 77.41 (Photo by Michael Steele/Getty Images) Photo: Michael Steele

3. Liverpool
Actual League Position: 3rd Goals For: 68 Goals Against: 42 Points: 69 xLP: 3rd (=) xGF: 72.21 xGA: 47.3 xP: 68.8 (Photo by Paul Ellis - Pool/Getty Images) Photo: Pool

4. Manchester United
Actual League Position: 2nd Goals For: 73 Goals Against: 44 Points: 74 xLP: 4th (-2) xGF: 63.7 xGA: 41.92 xP: 65.64 (Photo by Catherine Ivill/Getty Images) Photo: Catherine Ivill