
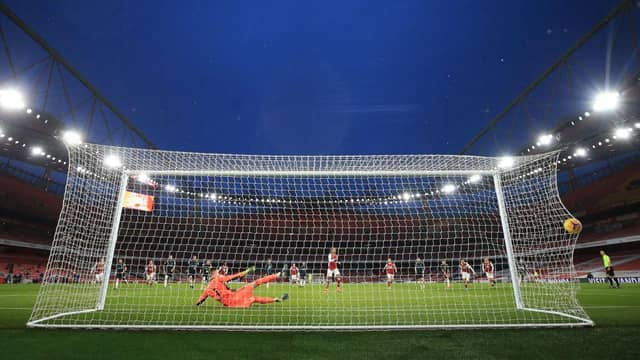

The Blades conceded a spot kick in the early stages of that clash, only to see the decision overturned after a VAR intervention.
Chris Wilder’s men weren’t as fortunate a second time, however, and Declan Rice stepped up to convert from 12 yards just before half-time.
That penalty was the fourth that United have conceded in the Premier League this season – the ninth-highest in the division.
It isn’t all doom and gloom, however with the Blades scoring three times from the spot themselves.
But how does Sheffield United' s record compare to their Premier League rivals over the past decade?
Paddy Power have run the numbers to which top flight teams have averaged the most penalties per game since 2010/11.
Click and scroll through the the countdown below:
*All data correct as of 20/1/21.

1. Burnley
Penalties: 14 Games: 209 Penalties per game: 0.07 (Photo by Laurence Griffiths/Getty Images) Photo: Laurence Griffiths

2. Newcastle United
Penalties: 27 Games: 363 Penalties per game: 0.07 (Photo by Stu Forster/Getty Images) Photo: Stu Forster

3. Aston Villa
Penalties: 25 Games: 286 Penalites per game: 0.09 (Photo by Lindsey Parnaby - Pool/Getty Images) Photo: Pool

4. Sheffield United
Penalties: 5 Games: 57 Penalties per game: 0.09 (Photo by Stu Forster/Getty Images) Photo: Stu Forster