We’ve compiled a list of the Sheffield neighbourhoods with the highest estimated average annual household income, based on figures published by the Office for National Statistics. The highest average income, according to the statistics, is £65,700, while the lowest is £28,200.
The average household income for Sheffield as a whole is £40,688, which is below the England-wide average of £43,966 but above that for Manchester (£36,251), Liverpool (£34,101) and Birmingham (£37,264).
The list we have published uses figures for so-called Metropolitan Super Output Areas (MSOA) within Sheffield, of which there are 70 listed. The estimates were calculated using regional figures from the Family Resources Survey and modelling down to neighbourhood level based on characteristics of the neighbourhood obtained from census and administrative statistics. The statistics are the latest published by the Office for National Statistics in March 2020, and they were shared on the Sheffield Local Insight website run by Sheffield Council.

1. Highest average incomes
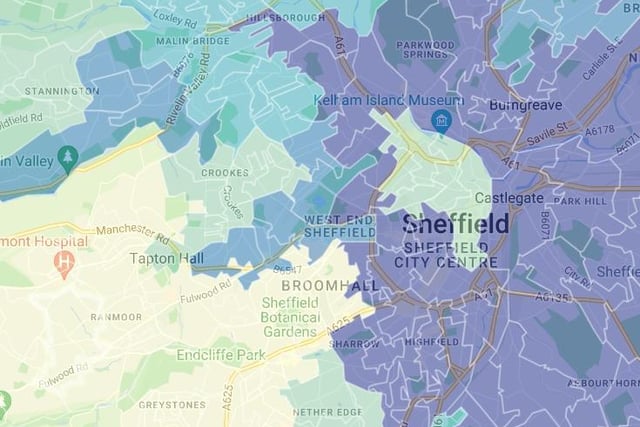
This map shows the most affluent and poorest areas of Sheffield, based on the average annual household income for each neighbourhood. The lighter the colour, the higher the income Photo: Sheffield Local Insight/Sheffield City Council

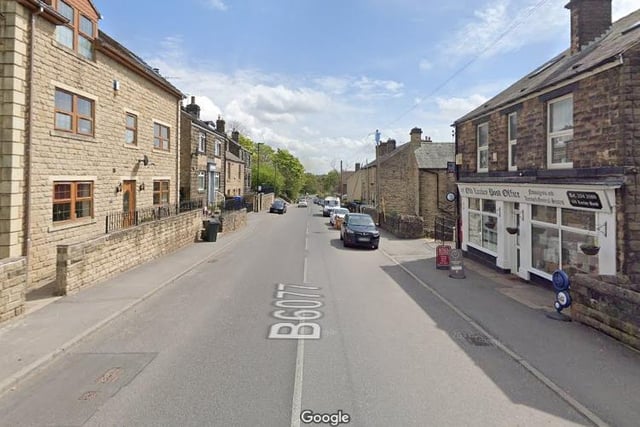
2. Upper Stannington & Loxley - £45,900
The average annual household income in Upper Stannington & Loxley is £45,900, which is the 18th highest of all Sheffield neighbourhoods, according to the latest Offic for National Statistics figures published in March 2020 Photo: Google

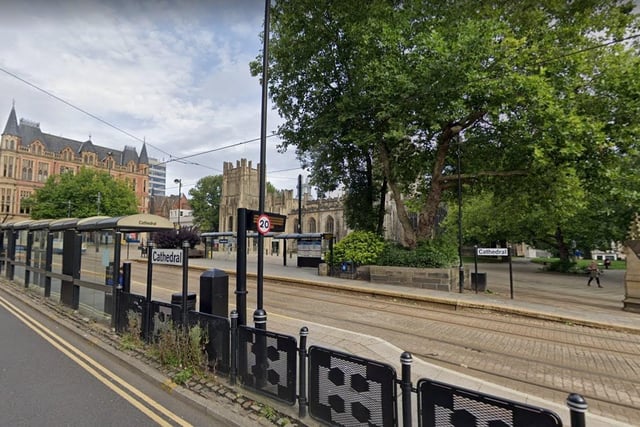
3. Cathedral & Kelham - £46,000
The average annual household income in Cathedral & Kelham is £46,000, which is the 17th highest of all Sheffield neighbourhoods, according to the latest Offic for National Statistics figures published in March 2020 Photo: Google

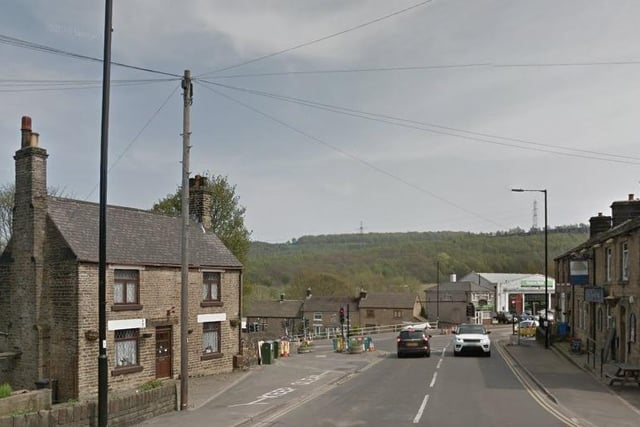
4. Deepcar & Bolsterstone - £46,400
Deepcar & Bolsterstone has an average annual household income of £46,400, which is the 16th highest in Sheffield, based on the latest figures published by the Office for National Statistics in March 2020 Photo: Google Maps