
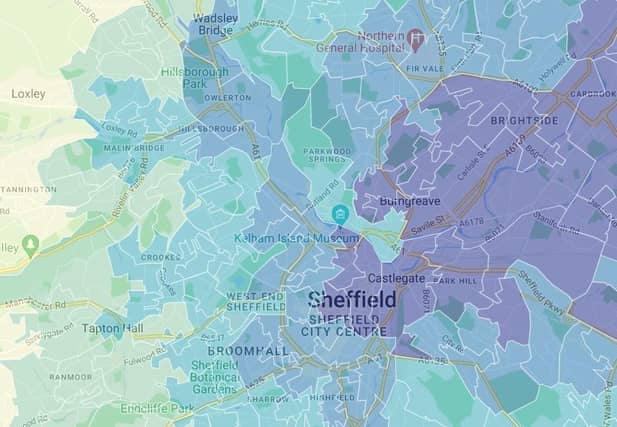

The air in Sheffield is slightly cleaner on average than in England as a whole, latest figures suggest, but in parts of the city air pollution is significantly higher than the national average. The Indices of Deprivation Air Quality indicator, published in 2019, is based on the concentration of four key pollutants – nitrogen dioxide, benzene, sulphur dioxide and particulates. The higher the figure, the worse the quality of the air you are breathing.
In Sheffield, the figure of 0.926 is below the England-wide number of 0.957 and lower than most major cities, including Birmingham (1.241), Leeds (1.010), Manchester (1.140) and Nottingham (1.193).
But while one area of Sheffield has an air pollution figure of just 0.679, in another part of the city it is nearly double that, at 1.242.
Below are the areas of Sheffield with the worst air quality, based on the most up-to-date statistics from the Ministry of Housing Communities and Local Government (MHCLG).
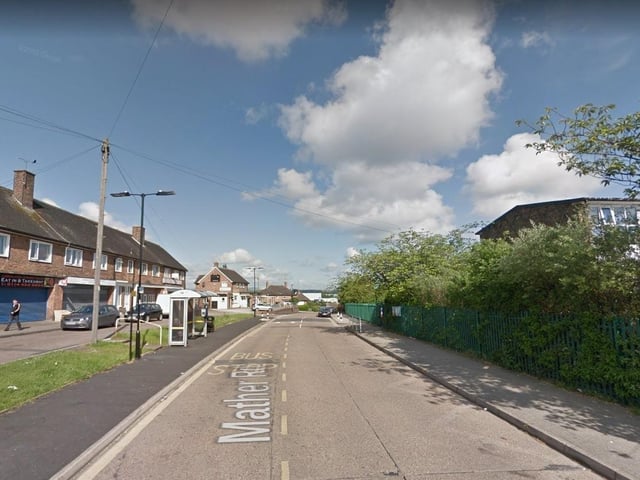
5. Littledale and Handsworth - 1.066
In Littledale and Handsworth, the Indices of Deprivation (IoD) 2019 Air Quality indicator is 1.066, which is the 10th worst figure out of 70 neighbourhoods across Sheffield Photo: Google
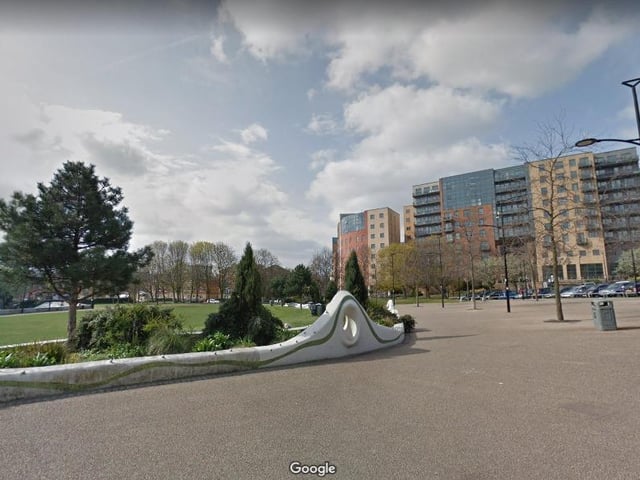
6. Devonshire Quarter - 1.069
In Devonshire Quarter, the Indices of Deprivation (IoD) 2019 Air Quality indicator is 1.069, which is the ninth worst figure out of 70 neighbourhoods across Sheffield Photo: Google
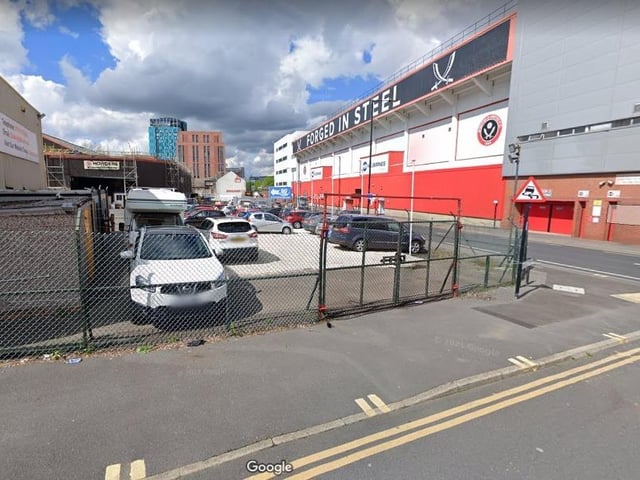
7. Highfield & Lowfield - 1.077
In Highfield & Lowfield, the Indices of Deprivation (IoD) 2019 Air Quality indicator is 1.077, which is the eighth worst figure out of 70 neighbourhoods across Sheffield Photo: Google
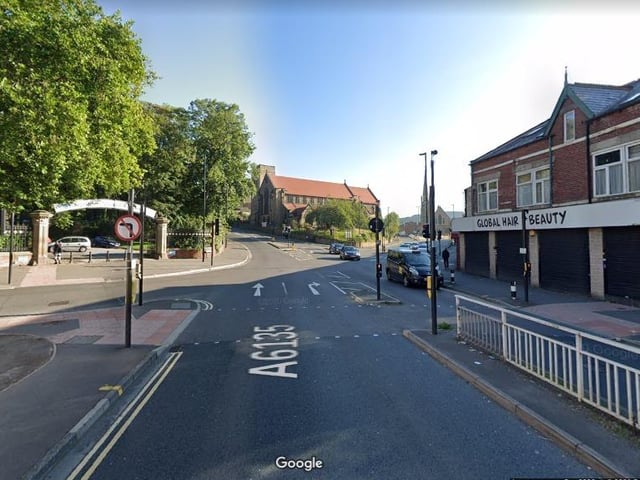
8. Crabtree & Fir Vale - 1.114
In Crabtree & Fir Vale, the Indices of Deprivation (IoD) 2019 Air Quality indicator is 1.114, which is the seventh worst figure out of 70 neighbourhoods across Sheffield Photo: Google