
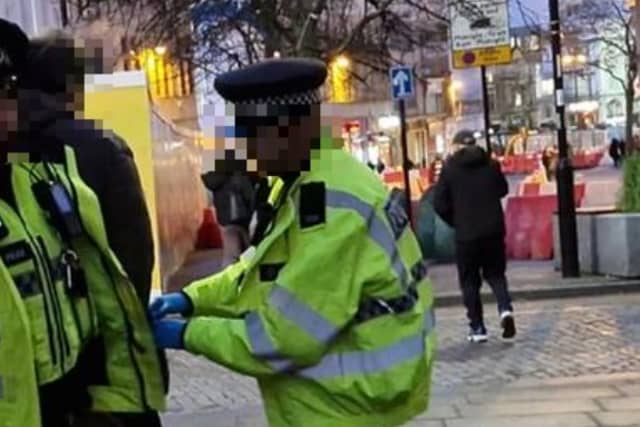


We have used them to create a list of the worst hot spots, according to police figures for ‘possession of weapon’ offences.
We have used figures taken from Sheffield Council statistics, based on official police numbers, which break down ‘possession of a weapon’ offences in the city into specific neighbourhoods.
The figure we have used in the rankings is the number of incidents per 1,000 residents in that neighbourhood.
The Star has taken those figures and created a gallery showing which parts of the city those figures suggest people are most likely to have a weapon. The type of weapon is not specified in the figures, so could include guns or knives, or other weapons.
The figures relate to a 12 month period from September 2023 to August 2024.
And they are divided up into 70 neighbourhoods in the council figures. The figures are based on where the incidents occurred, not where they were reported from.
We have listed the 24 neighbourhoods in the city with the largest number of reported possession of a weapon offences in the gallery below, with the smaller number of offences per person at top, and the area with the largest number listed last.
The photos are for illustrative purposes only and figures do not refer to any individual buildings or streets.
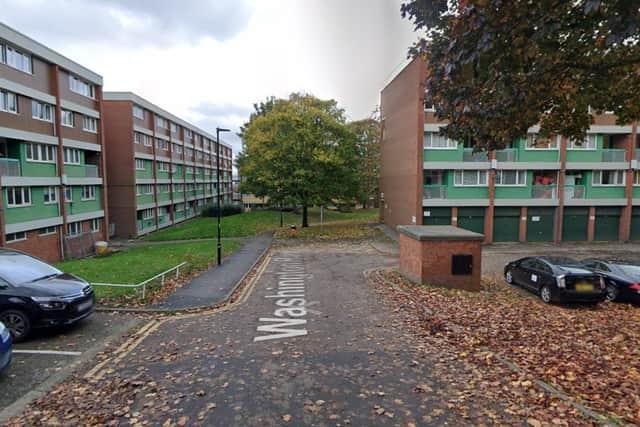
13. 13th: Sharrow
13: Sharrow had 2.5 neighbourhood-level incidents of possession of a weapon per 1,000 residents and a total of 24 overall. Photo: Google | Google
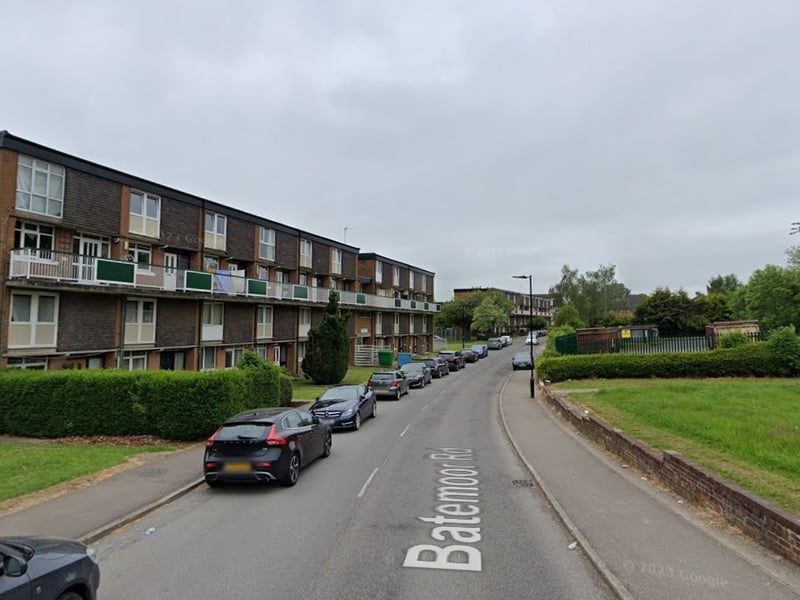
14. 12th: Batemoor & Jordanthorpe
12th: Batemoor & Jordanthorpe had 2.6 neighbourhood-level incidents of possession of a weapon per 1,000 residents and a total of 17 overall. Photo: Google | Google Photo: Google
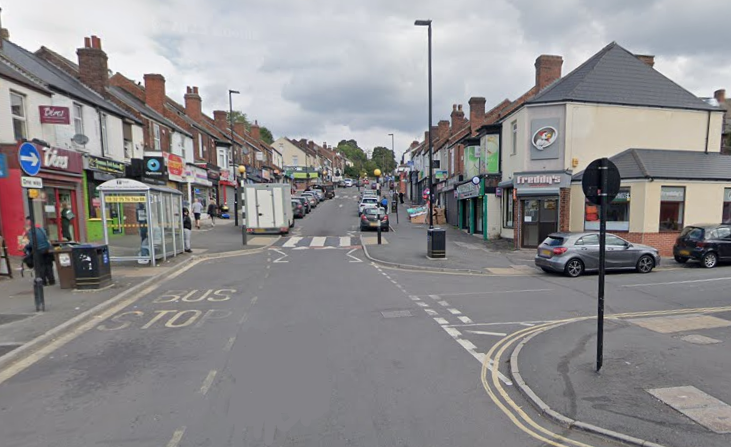
15. 11th: Firth Park
11th: Firth Park had 2.6 neighbourhood-level incidents of possession of a weapon per 1,000 residents and a total of 21 overall. Photo: Google | Google

16. 10th: Brightside & Wincobank
10th: Brightside & Wincobank had 2.7 neighbourhood-level incidents of possession of a weapon per 1,000 residents and a total of 26 overall. Photo: Google | Google Photo: Google