


Concerns over knife crime prompted a march calling for action to deal with the problem on Saturday, February 8, while the Parkway was closed for 30 hours over fears for the safety of a man who it was thought may have had a weapon.
We have looked at newly released figures showing the Sheffield neighbourhoods which have recorded the fewest cases of weapon related crime - and we have put together a gallery showing where they are.
Police figures record the number of offences reported in the city under the category of ‘possession of a weapon’. And Sheffield Council collates those by neighbourhood.
We have used those to put together a list of the 23 neighbourhoods in the city showing the fewest reports of ‘possession of a weapon’ offences.
In each case, the figure used for the ranking is the number of incidents per 1,000 residents in that neighbourhood. If they are equal, we have also taken into account the total number of incidents in that neighbourhood overall. We have stated both numbers.
The type of weapon is not specified in the figures, so could include guns or knives, or other weapons.
The figures relate to a 12 month period from December 2023 to November 2024.
Make sure you don’t miss any of the breaking news and biggest headlines from Sheffield and South Yorkshire with our free daily newsletter.
And they are divided up into 70 neighbourhoods in the council figures. The figures are based on where the incidents occurred, not where they were reported from.
We have listed the places with higher numbers of offences per person at the top, and the area with the smallest number listed last.
The photos are for illustrative purposes only and figures do not refer to any individual buildings or streets.
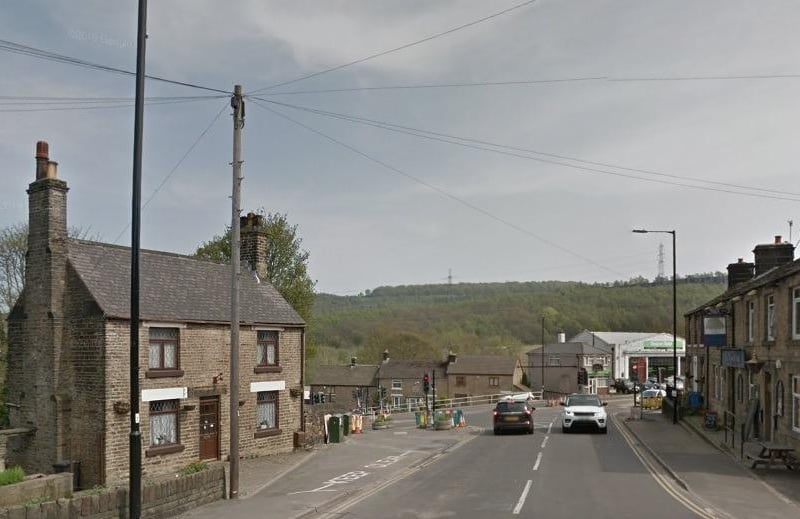
21. Fourth: Deepcar & Bolsterstone
Joint third: Deepcar & Bolsterstone had 0.2 neighbourhood-level incidents of possession of weapons per 1,000 residents and a total of one overall. Photo: Google Photo: Google Maps

22. Joint third: Sandygate & Crosspool
Joint third: Sandygate & Crosspool had 0.2 neighbourhood-level incidents of possession of weapons per 1,000 residents and a total of one overall. Photo: Google | Google Photo: Google

23. Second: Dore & Whirlow
Second: Dore & Whirlow had 0.1 neighbourhood-level incidents of possession of weapons per 1,000 residents and a total of one overall. Photo: Google | Google Photo: Google

24. Fewest incidents: Ecclesall & Greystones
Fewest incidents: Ecclesall & Greystones had the lowest number of neighbourhood-level incidents of possession of weapons, with no incidents per 1,000 residents and none overall. Photo: Google | Google Photo: Google