
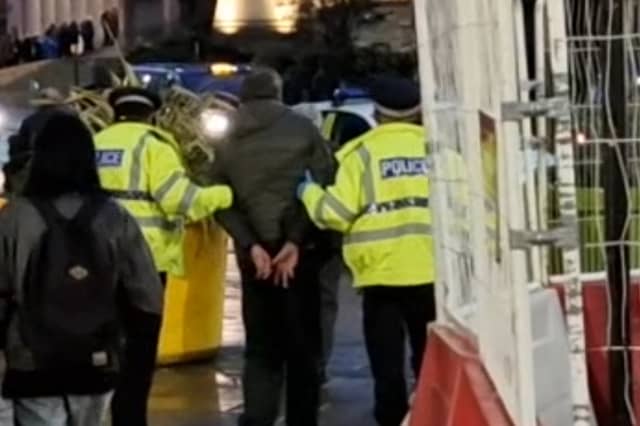


The numbers are official figures for Sheffield from Police UK, and we have ranked them in order, based on the 70 neighbourhoods which the city is divided into in the statistics.
They cover the period from December 2024 until November 2025.
You can see the 22 parts of the city with the most incidents of drug crime in the gallery below.
They are based on the 12 month total of neighbourhood-level incidents of what police class as ‘drugs crime’, and as a rate per 1,000 residents. We have also included the overall number of incidents in that area.
The figures are based on where the incidents occurred, not where they were reported from.
The photos are for illustrative purposes only and figures do not refer to any individual buildings or streets.
Take a look at the gallery below.
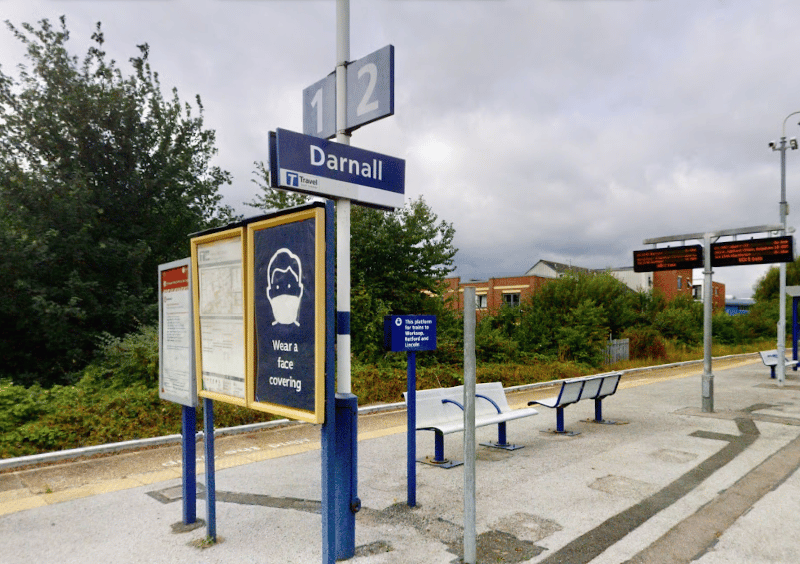
9. Darnall - 15th
Darnall saw 5.3 reports of drug crime offences per 1,000 residents from December 2024 to November 2025, the 15th highest figure in Sheffield. The total number of incidents in that neighbourhood was 47. Photo: Google | Google Photo: Google

10. Heeley & Newfield Green - 14th
Heeley & Newfield Green saw 5.4 reports of drug crime offences per 1,000 residents from December 2024 to November 2025, the 14th highest figure in Sheffield. The total number of incidents in that neighbourhood was 43. Photo: Google | Google Photo: Google

11. Woodthorpe - 13th
Woodthorpe saw 5.4 reports of drug crime offences per 1,000 residents from December 2024 to November 2025, the 13th highest figure in Sheffield. The total number of incidents in that neighbourhood was 64. Photo: Google | Google Photo: Google
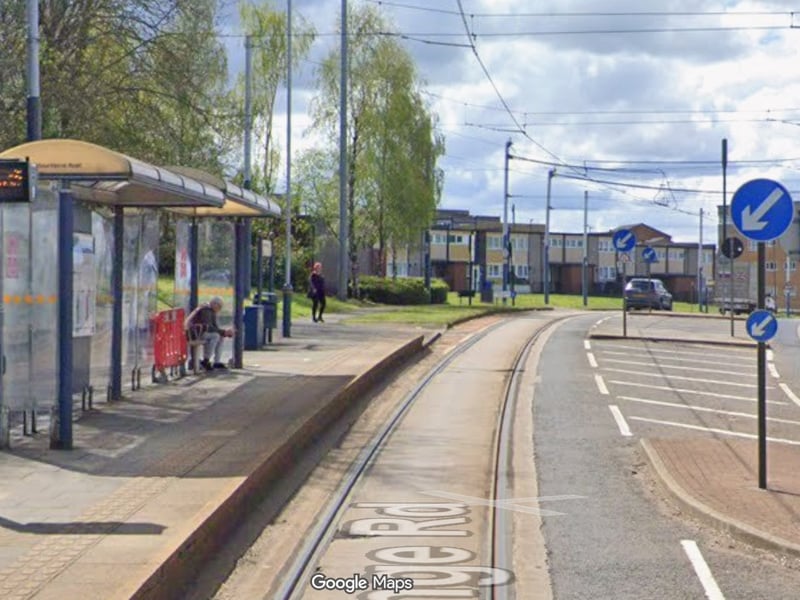
12. Arbourthorne - 12th
Arbourthorne saw 5.5 reports of drug crime offences per 1,000 residents from December 2024 to November 2025, the 12th highest figure in Sheffield. The total number of incidents in that neighbourhood was 32. Photo: Google | Google Photo: Google