
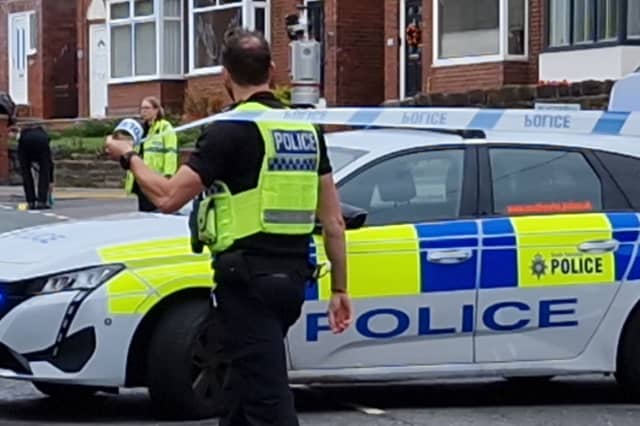


The numbers published by Police UK show the neighbourhoods with the largest number of incidents of vehicle crime recorded between December 2024 and November 2025.
We have broken them down to show the number of incidents per 1,000 residents in 22 neighbourhoods of the 70 that make up the city.
The figures also show Sheffield to have some of the higher figures among big cities in England for car crime in the same period.
The city had 7.4 incidents per 1,000 people as a whole, a total of 4,315 incidents across the city. That compares with 10.1 (11,897) in Birmingham, 7.3 (3,622) in Bristol, 6.9 (5,790) in Leeds, 6.5 (2,164) in Nottingham, 5.8 (1,872) in Newcastle, and 5.3 (2,701) in Liverpool,
Our gallery, below, shows the 22 neighbourhoods which have the worst figures for vehicle crime during that time, which includes both thefts of cars and other types of vehicles themselves, and incidents of thefts of items from cars.
The figures show both the total number of reports of incidents of vehicle crime, and the number as a rate per 1,000 residents.
Sign up for our newsletter today, where we bring you all of the breaking news and recent stories from across Sheffield and South Yorkshire
We have ranked the figures by the number of reports per 1,000 residents. If those two neighbourhoods were equal, we took into account the overall number for the neighbourhood.
The figures are based on where the incidents occurred, not where they were reported from. The photos are for illustrative purposes only and figures do not refer to any individual buildings or streets.

9. Woodthorpe - 15th
Woodthorpe saw 9.1 reports of vehicle crime per1,000 residents from December 2024 to November 2025, the 15th highest figure in Sheffield. The total number of incidents in that neighbourhood was 108. Photo: Google | Google Photo: Google
10. Broomhall - 14th
Broomhall saw 9.2 reports of vehicle crime per1,000 residents from December 2024 to November 2025, the 14th highest figure in Sheffield. The total number of incidents in that neighbourhood was 72. Photo: Google | Google Photo: Google

11. Woodhouse West - 13th
Woodhouse West saw 9.5 reports of vehicle crime per1,000 residents from December 2024 to November 2025, the 13th highest figure in Sheffield. The total number of incidents in that neighbourhood was 58. Photo: Google | Google Photo: Google
12. Arbourthorne - 12th
Arbourthorne saw 10.0 reports of vehicle crime per1,000 residents from December 2024 to November 2025, the 12th highest figure in Sheffield. The total number of incidents in that neighbourhood was 58. Photo: Google | Google Photo: Google