
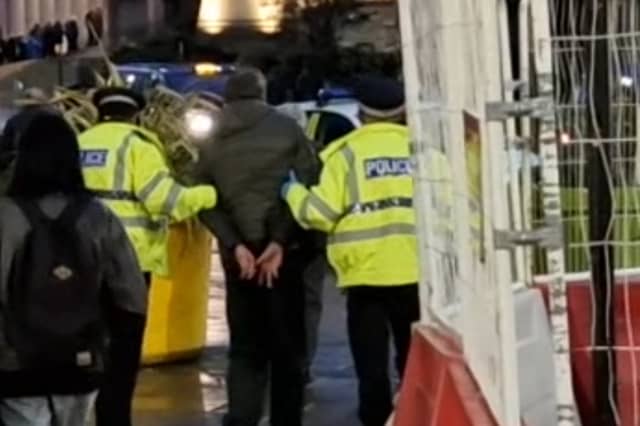


We have looked at the figures, and have now used them to compile a list of the worst hot spots for becoming a victim of a robbery in the city.
Robbery is when someone steals something from a person or place by force or threat of force, for example threatening to assault them if they don’t hand valuables over. It could happen in the street or in a building, like a shop.
We have used figures taken from Sheffield Council statistics, based on official police numbers, which break down robberies in the city into specific neighbourhoods.
In each case, the figure is the number of robberies per 1,000 residents in that neighbourhood.
The Star has taken those figures and created a gallery showing which parts of the city those figures suggest you are most likely to be robbed
The figures relate to a 12 month period from March 2023 to February 2024.
And they are divided up into 70 neighbourhoods in the council figures. The figures are based on where the robberies occurred, not where they were reported from.
We have listed the 25 neighbourhoods in the city with the largest number of reported robberies in the gallery below, with the smaller number of robberies per person at top, and the area with the largest number listed last.
The photos are for illustrative purposes only and figures do not refer to any individual buildings or streets.
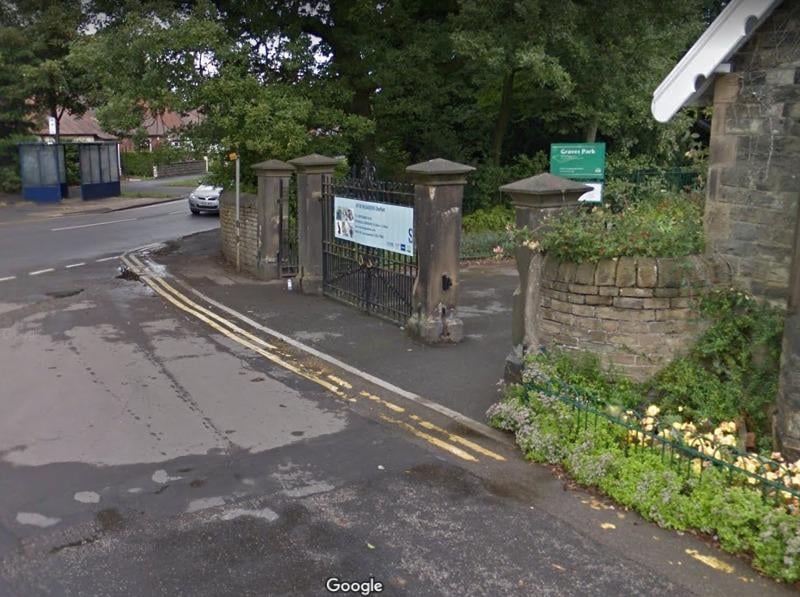
21. 6. Norton & Norton Lees
6. Norton & Norton Lees had 4.1 neighbourhood-level incidents of robbery per 1,000 residents and a total of 38 overall. Photo: Google Photo: Google
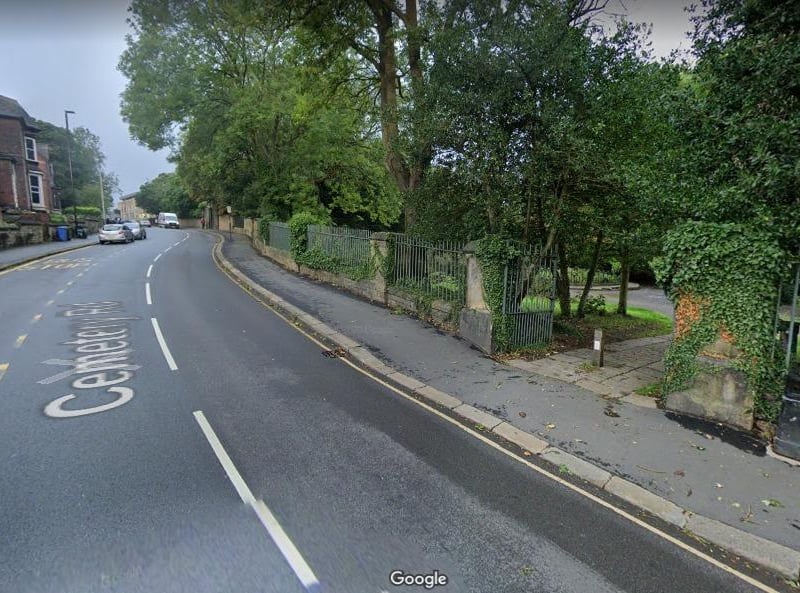
22. 5. Sharrow
5. Sharrow had 4.1 neighbourhood-level incidents of robbery per 1,000 residents and a total of 39 overall. Photo: Google Photo: Google
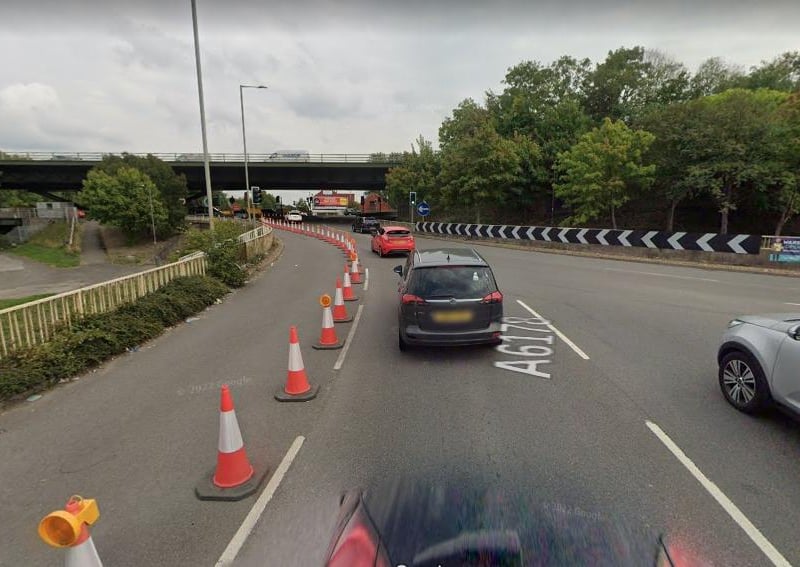
23. 4. Tinsley and Carbrook
4. Tinsley & Carbrook had 4.8 neighbourhood-level incidents of robbery per 1,000 residents and a total of 32 overall. Photo: Google Photo: Google

24. 3, Burngreave & Grimesthorpe
3. Burngreave & Grimesthorpe had 6.0 neighbourhood-level incidents of robbery per 1,000 residents and a total of 76 overall. Photo: Google | Google Photo: Google