
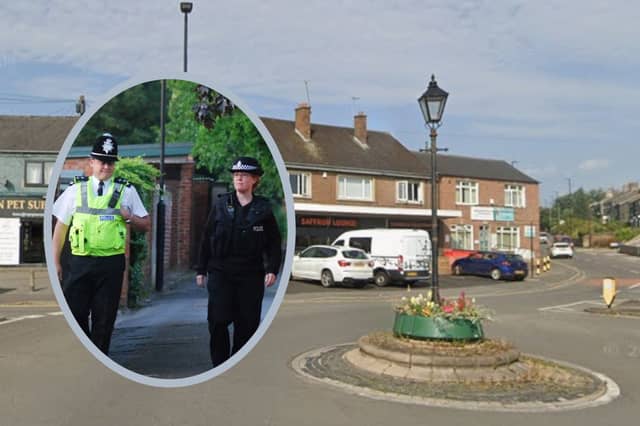


We have looked at statistics taken from Sheffield Council figures which break down burglary numbers in Sheffield into 70 separate neighbourhoods. They are based on South Yorkshire Police data.
And we have used those to create a gallery below revealing the areas which turned out to have the fewest break-ins across the city.
The figures relate to the 12 month period from December 2023 November 2024. They have only just been issued.
We have listed the the 22 neighbourhoods in the city with the fewest burglaries in the gallery below, with the largest number of burglaries top, and the area with the fewest listed last.
The are ranked by the number of neighbourhood-level burglaries per 1,000 households. We have also included the total number of burglaries in that part of the city, and if the per household figure is tied, we have taken the total number into account in the ranking.
The photos are for illustrative purposes only and figures do not refer to any individual buildings or streets.
Take a look and see if your neighbourhood features.
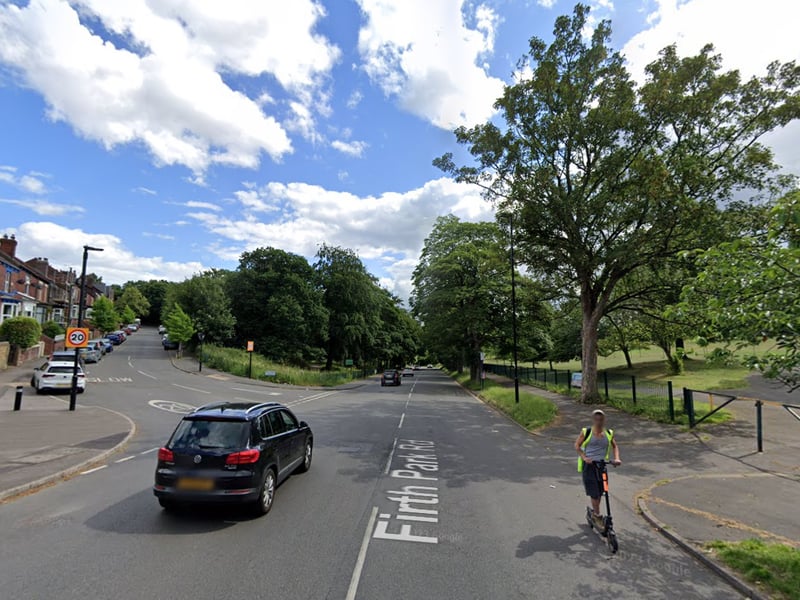
9. 15th. Firth Park
15th: Firth Park had 12.7 neighbourhood-level burglaries per 1,000 households, and a total of 41 overall, between December 2023 and November 2024. Photo: Google. | Google
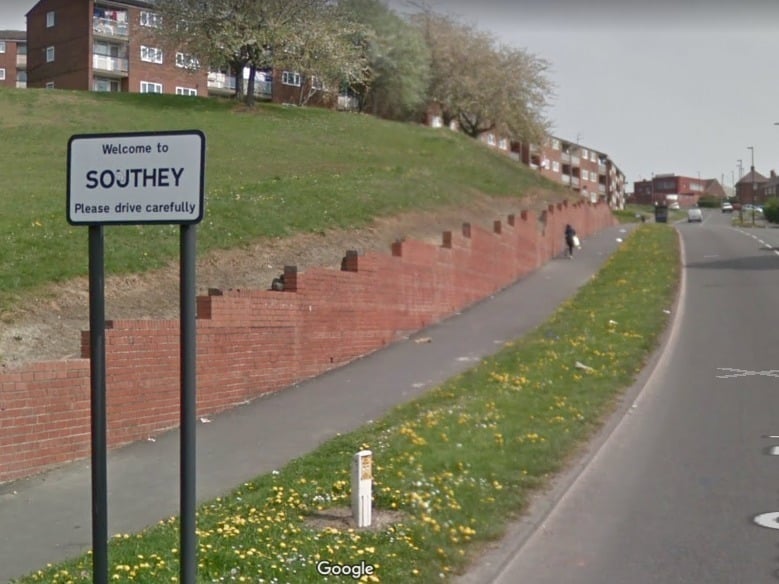
10. 14th: Southey Green West
14th: Southey Green West had 12.5 neighbourhood-level burglaries per 1,000 households, and a total of 50 overall, between December 2023 and November 2024. Photo: Google. | Google Photo: Google
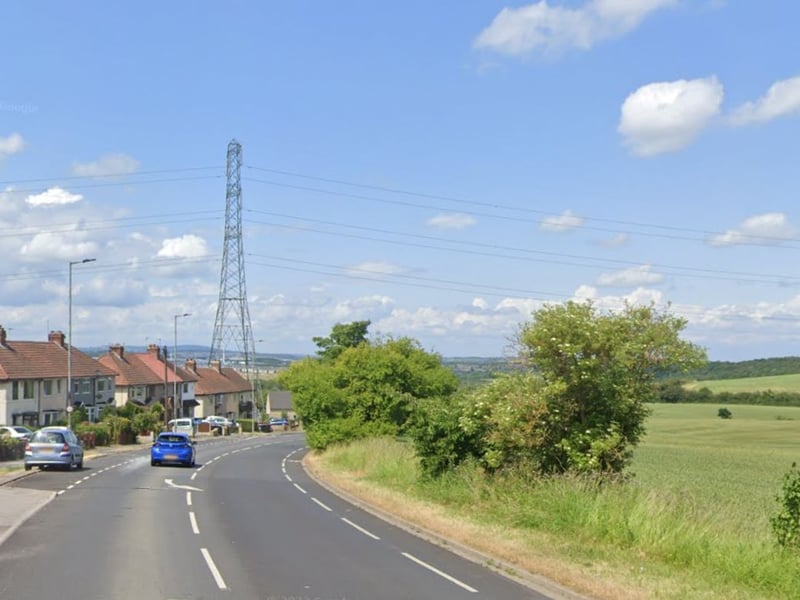
11. 13th. Woodhouse Mill
13th: Woodhouse Mill had 12.5 neighbourhood-level burglaries per 1,000 households, and a total of 33 overall, between December 2023 and November 2024. Photo: Google. | Google Photo: Google
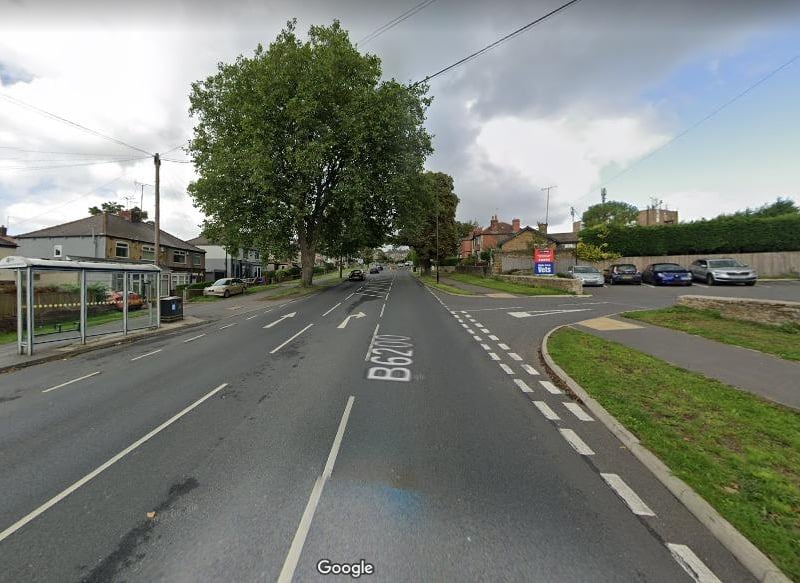
12. 12th: Handsworth South
12th: Handsworth South had 12.2 neighbourhood-level burglaries per 1,000 households, and a total of 33 overall, between December 2023 and November 2024. Photo: Google. Photo: Google