



Official statistics show which districts in the city have seen the most violent crime and sexual offences in the last year, over the most recent 12 months for which figures are available, which is from June 2023 to May 2024
We have taken the official figures provided by Sheffield Council’ s Local Insights, which is based on official South Yorkshire Police data over the 12 month period. It has been divided into 71 neighbourhoods.
We have listed the top 22 in reverse order, so the first picture is the area in 22nd place, and the last one is the area with the most violent incidents per person.
The figures show the 12 month total of neighbourhood-level incidents of violent crime and sexual offences recorded by police, as a rate per 1,000 residents. We have ranked then on that figure, but we have also stated the total number of incidents in each of those areas.
The figures for violence do not include robberies, but do include sexual offences. The incidents are recorded in the area where they occurred, and the rate is stated as the number of cases per person living in the neighbourhood.
Sheffield is one of the safest cities according the same figures, which rank it as having the least violent crime per head of population out of the big provincial UK cities - Birmingham, Bristol, Leeds, Liverpool, Manchester, Newcastle, Nottingham and Sheffield.
To report a crime to South Yorkshire Police calling them on 101 or through their online portal at: https://smartcontact.southyorkshire.police.uk/
In an emergency, call 999.
The photos used in our gallery are for illustrative purposes only, and do not imply that a violent crime happened at that specific location. You can see the areas topping the list below.
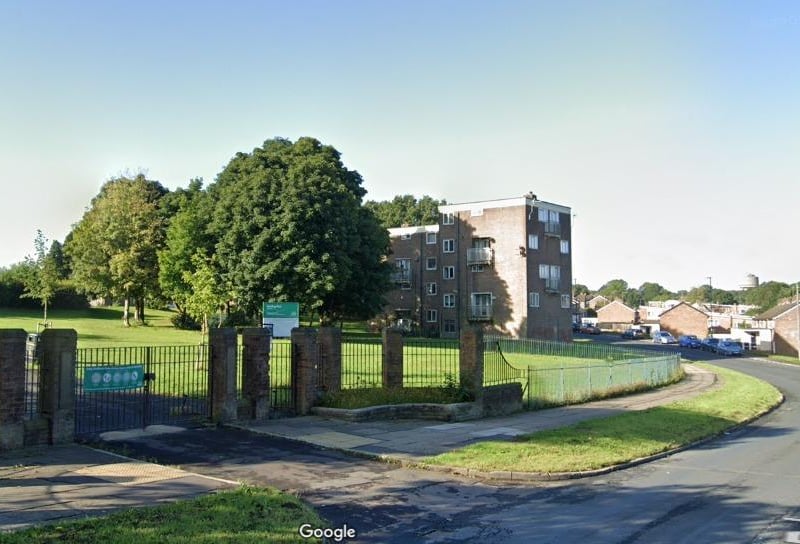
9. 15. Herdings & Gleadless Valley
15. Herdings & Gleadless Valley had 72.8 reports of violent crime or sexual offences per 1,000 population from June 2023 to May 2024, a total of 442 incidents overall. Photo: Google streetview Photo: Google
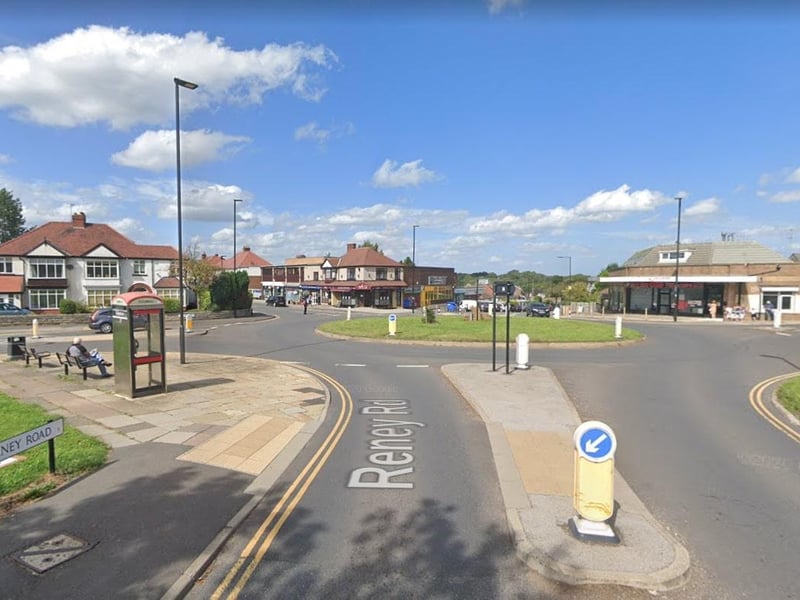
10. 14. Greenhill and Lowedges
14. Greenhill & Lowedges had 73.4 reports of violent crime or sexual offences per 1,000 population from June 2023 to May 2024, a total of 473 incidents overall. Photo: Google streetview Photo: Google
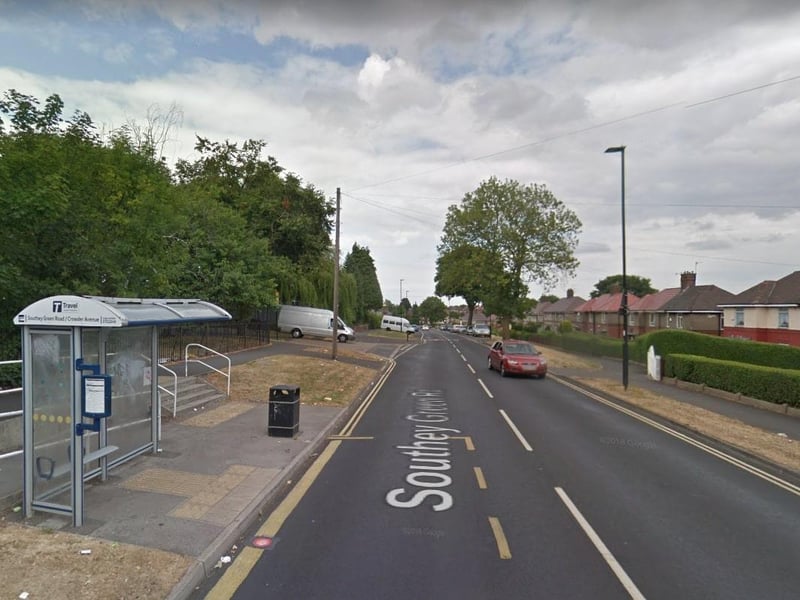
11. 13. Southey Green East
13. Southey Green East had 75.6 reports of violent crime or sexual offences per 1,000 population from June 2023 to May 2024, a total of 609 incidents overall. Photo: Google streetview Photo: Google

12. 12. Parson Cross
12. Parson Cross had 76.8 reports of violent crime or sexual offences per 1,000 population from June 2023 to May 2024, a total of 789 incidents overall. Photo: Google streetview | Google Photo: Google