
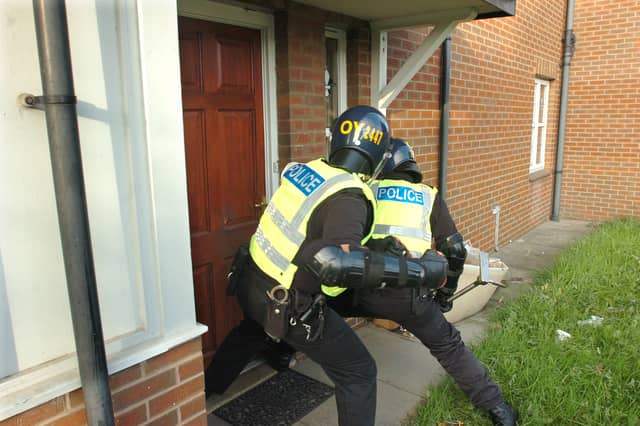


We have used official figures to put together the gallery below, which shows the 25 areas of the city which saw the most reports of drug related crime.
The statistics are based on police figures, listed in the 70 neighbourhoods which make up Sheffield.
The figures are based on reports to police of incidents between December 2023 and November 2024, and are recognised by Sheffield Council.
They show the 12 month total of neighbourhood-level incidents of drug crime, and as a rate per 1,000 residents. We have ranked them as the rate per 1,000 residents.
The figures are based on where the incidents occurred, not where they were reported from.
We have listed the 25 neighbourhoods in the city with the largest number of drug crimes in the gallery below, with the smaller number of cases per person at top, and the area with the largest number listed last.
The photos are for illustrative purposes only and figures do not refer to any individual buildings or streets.
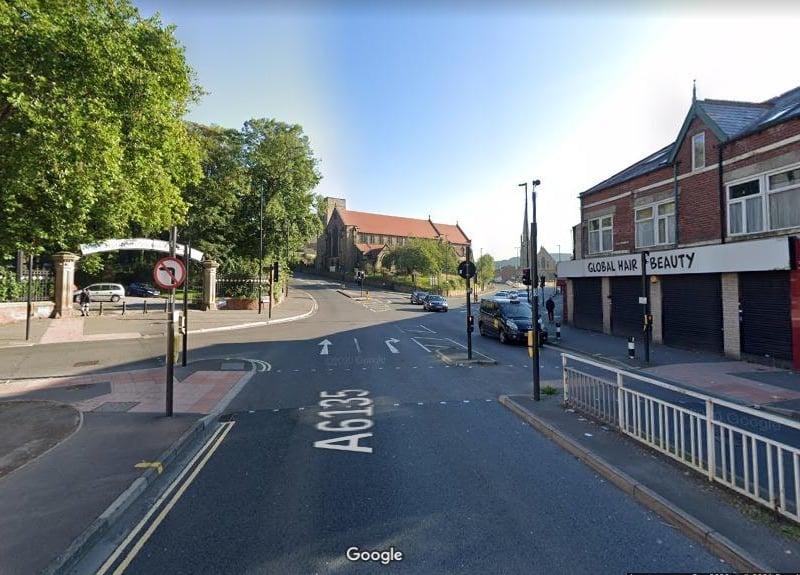
17. 10th: Crabtree & Fir Vale
10th: Crabtree & Fir Vale had 6.2 reports of drug crime per 1,000 population from December 2023 to November 2024, a total of 58 incidents overall. Photo: Google streetview Photo: Google
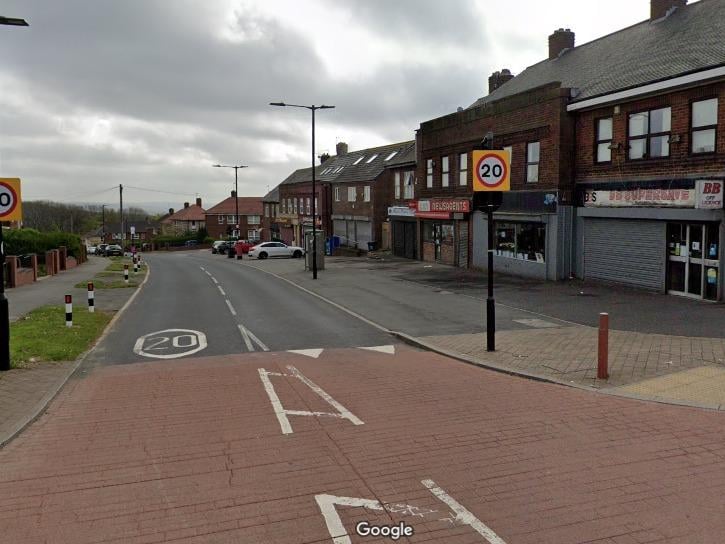
18. Ninth: Shirecliffe & Parkwood Springs
Ninth: Shirecliffe & Parkwood Springs had 6.5 reports of drug crime per 1,000 population from December 2023 to November 2024, a total of 44 incidents overall. Photo: Google streetview | Google Photo: Google
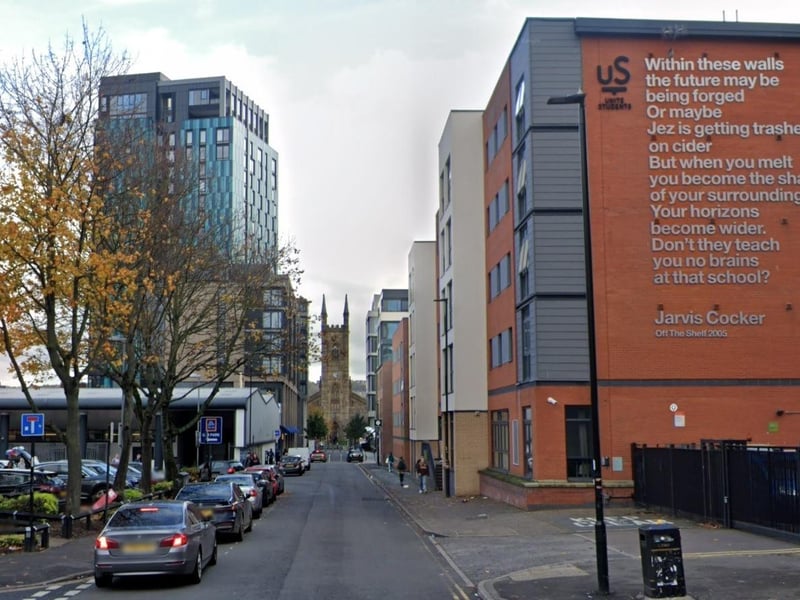
19. Eighth: Highfield & Lowfield
Eighth: Highfield & Lowfield had 6.7 reports of drug crime per 1,000 population from December 2023 to November 2024, a total of 95 incidents overall. Photo: Google streetview Photo: Google Maps

20. Seventh: Woodhouse West
Seventh: Woodhouse West had 7.1 reports of drug crime per 1,000 population from December 2023 to November 2024, a total of 42 incidents overall. Photo: Google streetview | Google Photo: Google