
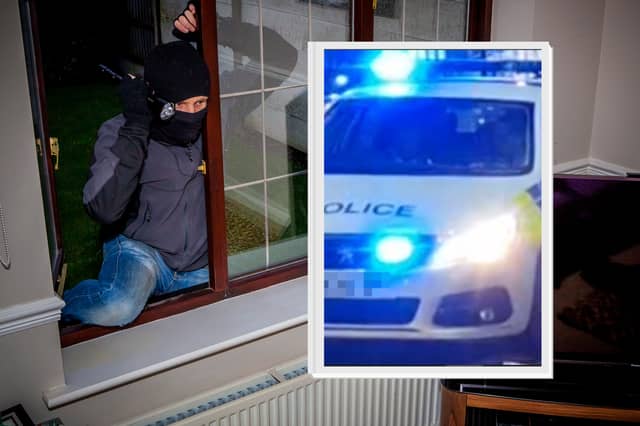


The Police UK figures, which are from the period between the start of December 2024 and the end of November 2025, divide the city into 70 neighbourhoods. You an see below the 22 places with the highest burglary rate per 1,000 residents in those figures.
The average for the city was 12.82 break-ins per thousand, and Sheffield had 2,970 burglaries over that period of time in total.
If the number of break-ins per 1,000 households is equal in two areas, we used the total number of break-ins to separate them in the rankings.
The photos that we have used are for illustrative purposes only and figures do not refer to any individual buildings or streets.
To avoid becoming a victim of burglars, South Yorkshire Police recommend:
> Ensuring all doors are locked, even if you are inside your home. Burglars will be looking for open doors as an easy opportunity to slip in
> Ensuring any side gates or outer buildings, like sheds and garages, are locked and secure where possible
> Considering installing a home CCTV and monitor light system
> Installing a burglar alarm, and set it when you leave your home
> Fitting a steering wheel lock on your vehicles, even if they are parked on your driveway
> Ensuring any spare car keys are stored in a safe place, away from your front door
> If you are planning on leaving your home to take a holiday, ask a neighbour or friend to check on your property and keep an eye out for any suspicious behaviour
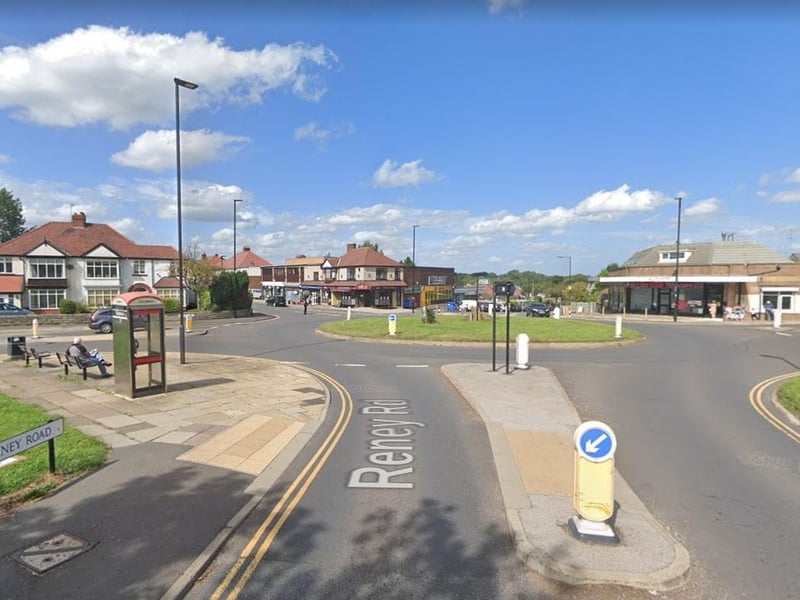
5. Greenhill & Lowedges - 19th
Greenhill & Lowedges saw 16.0 burglaries per thousand households from December 2024 to November 2025, the 19th worst figure. The total number of break ins in that neighbourhood was 47. Photo: Google Photo: Google

6. National World
Batemoor & Jordanthorpe saw 16.1 burglaries per thousand households from December 2024 to November 2025, the 18th worst figure. The total number of break ins in that neighbourhood was 49. Photo: Iconic Media | Iconic Media Photo: Iconic Media
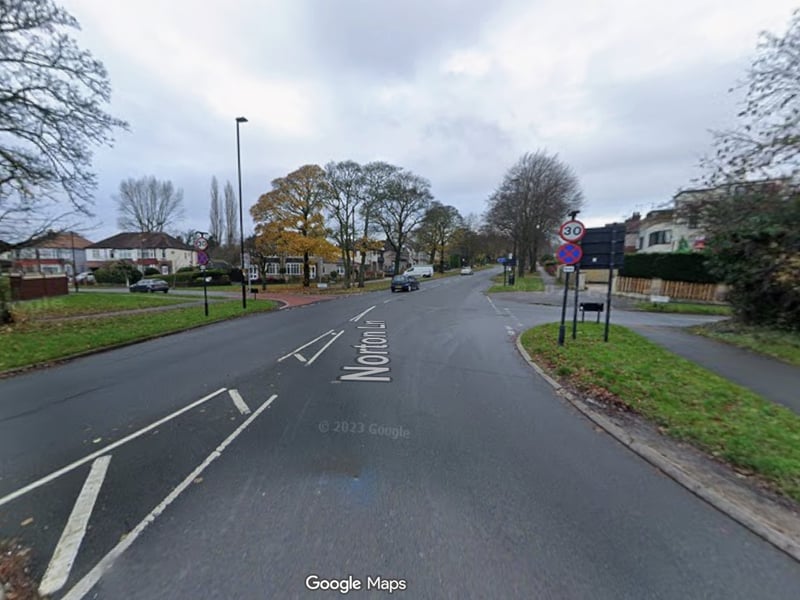
7. Norton & Norton Lees -17th
Norton & Norton Lees saw 16.3 burglaries per thousand households from December 2024 to November 2025, the 17th worst figure. The total number of break ins in that neighbourhood was 66. Photo: Google | Google Photo: Google
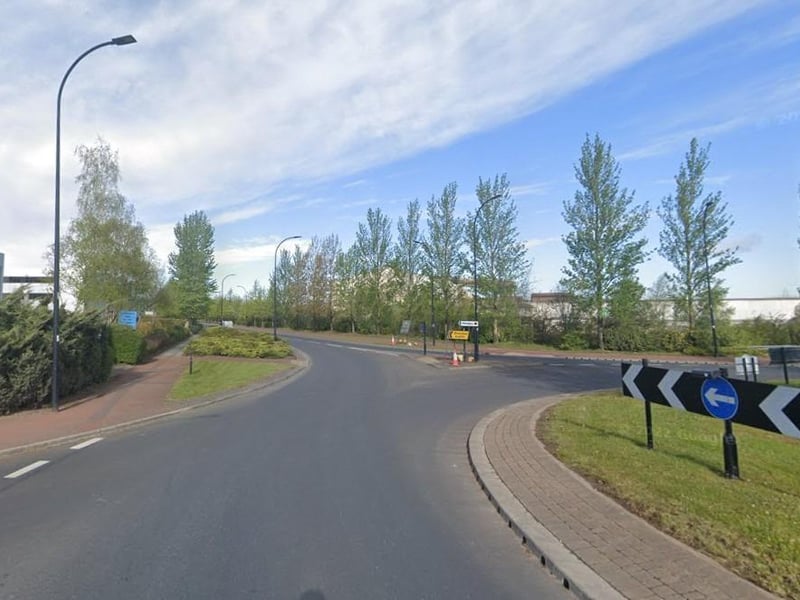
8. Tinsley and Carbrook - 16th
Tinsley & Carbrook saw 16.4 burglaries per thousand households from December 2024 to November 2025, the 16th worst figure. The total number of break ins in that neighbourhood was 35. Photo: Google Photo: Google