
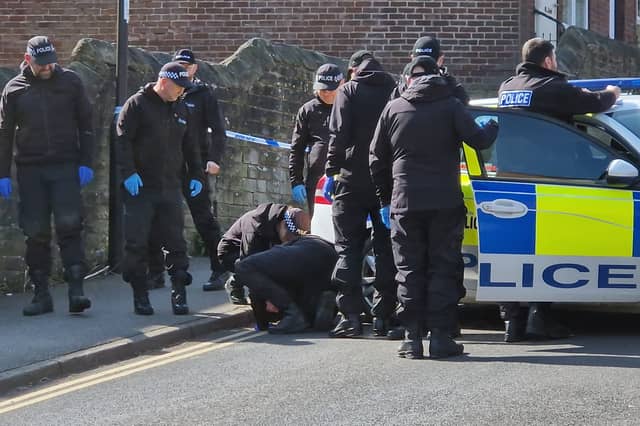


Police UK figures show that the areas listed below saw the most reports of violent crime and sexual offences per 1,000 residents over the year up to the end of November 2025.
The figures divide Sheffield into 70 neighbourhoods, and we have ranked areas on the basis of the number of violent crimes per person, although the figures also show the overall total for each of those top 21 areas.
The figures represent the period from December 2024 until November 2025.
The 21 areas which saw the most complaints are listed in the gallery below in descending order, with the most violent part of the city listed last.
The figures for violence do not include robberies, but do include sexual offences. The incidents are recorded in the area where they occurred.
To report a crime to South Yorkshire Police call them on 101 or contact them through their online portal at: https://smartcontact.southyorkshire.police.uk/
In an emergency, call 999.
The photos used in our gallery are for illustrative purposes only, and do not imply that a violent crime happened at that specific location.
Take a look at the gallery below to see where the worst hot spots were.
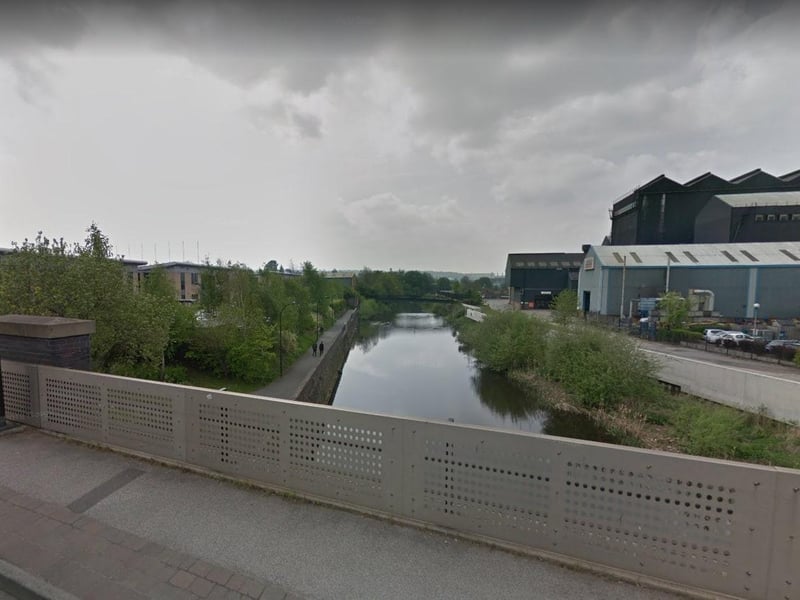
21. Tinsley & Carbrook - Second
Tinsley & Carbrook saw 85.5 reports of violent crime per 1,000 residents from December 2024 to November 2025, the second worst figure in Sheffield. The total number of incidents in that neighbourhood was 599. Photo: Google Photo: Google

22. Devonshire Quarter - Highest rate of violent crime in Sheffield
Devonshire Quarter saw 124.9 reports of violent crime per 1,000 residents from December 2024 to November 2025, the worst worst figure in Sheffield. The total number of incidents in that neighbourhood was 1,092. Photo: Google | Google Photo: Google