
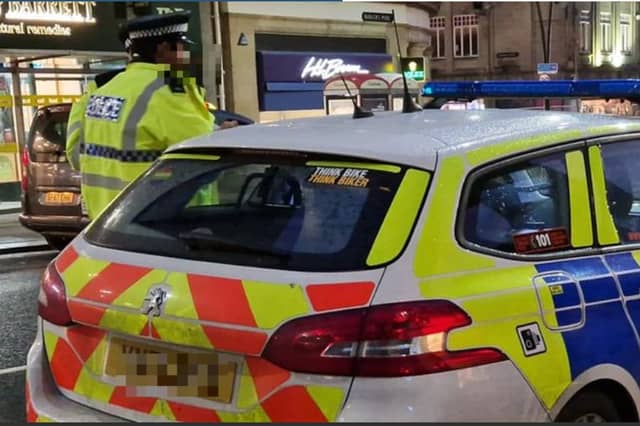


The latest figures show that there were 10,344 complaints about anti-social behaviour to police in Sheffield in the year from June 2024 to May 2025, which worked out at 18.3 per 1,000 residents in the city.
But some areas saw many more complaints than others - and we have listed the 20 areas with the most complaints in the gallery below. They have been ranked by the number of complaints per 1,000 people in that neighbourhood. We have also listed the total number of offences in each of those neighbourhoods.
The city is divided into 70 neighbourhoods in total for the figures.
There are a number of crimes associated with anti-social behaviour, including those relating to fireworks, neighbours, alcohol, nuisance motorbikes or quad bikes or youth-related offences.
All images are for illustrative purposes and do not represent a specific incident or location.
The figures are from Police UK.
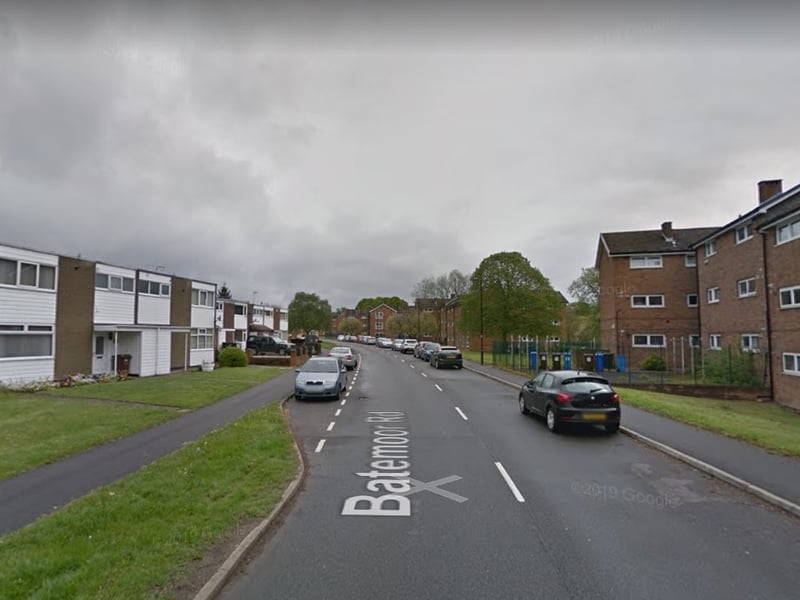
13. Batemoor & Jordanthorpe - 9th
Batemoor & Jordanthorpe saw 29.2 reports of antisocial behaviour per 1,000 residents from June 2024 to May 2025, the ninth worst figure. The total number of incidents in that neighbourhood was 187 Photo: Google | Google Photo: Google
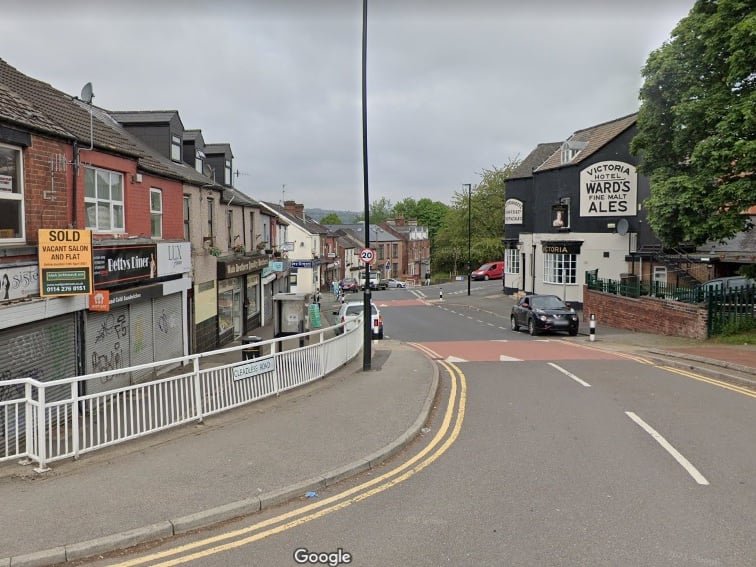
14. Heeley & Newfield Green - 8th
Heeley & Newfield Green saw 30.4 reports of antisocial behaviour per 1,000 residents from June 2024 to May 2025, the eighth worst figure. The total number of incidents in that neighbourhood was 232 Photo: Google | Google Photo: Google

15. Hillsborough, Owlerton & Wadsley Bridge - 7th
Hillsborough, Owlerton & Wadsley Bridge saw 31.3 reports of antisocial behaviour per 1,000 residents from June 2024 to May 2025, the seventh worst figure. The total number of incidents in that neighbourhood was 189 Photo: Google | Google Photo: Google
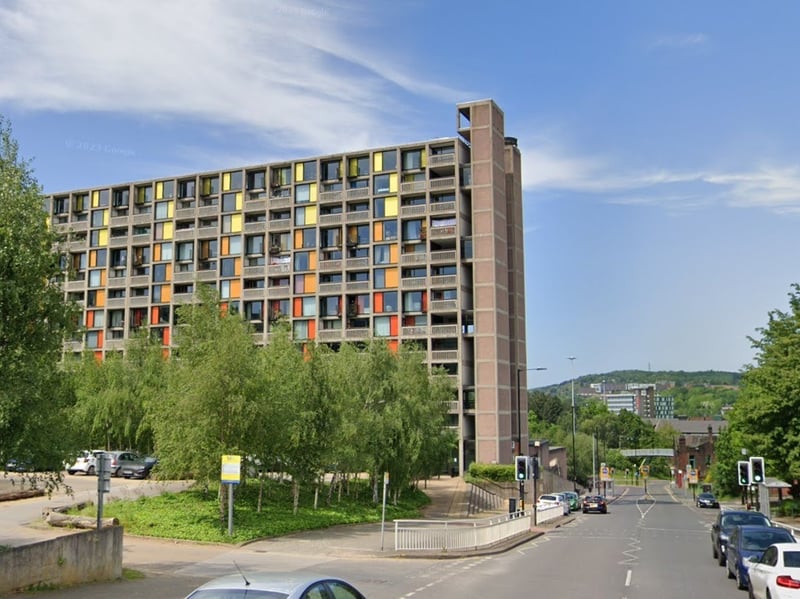
16. Park Hill & Wybourn - sixth
Park Hill & Wybourn saw 32.4 reports of antisocial behaviour per 1,000 residents from June 2024 to May 2025, the sixth worst figure. The total number of incidents in that neighbourhood was 402 Photo: Google | Google Photo: Google