

Official figures issued by Police UK show the neighbourhoods which have seen the most incidents, according to the most recent figures, which cover September 2024 to the end of August 2025.
The figures are divided into 70 separate Sheffield neighbourhoods across the city, and the gallery below shows the 13 of these which saw the most reports of vandalism.
The figures are for what is officially termed criminal damage, and they also include reports of arson.
They show the total number of reports of neighbourhood-level incidents of criminal damage, and the number as a rate per 1,000 residents. We have ranked the areas on the basis of the cases per 1,000 residents.
Sheffield as a whole saw 5,020 cases reported over the 12 month period, which works out at 8.6 incidents per 1,000 people.
It is fewer than most comparable cities per person, such as Birmingham (10,610 incidents, 9.0 per 1,000 people), Leeds (7,395; 8.7); Liverpool (5,335, 10.5); Newcastle (3,400, 10.6); and Nottingham (3,784, 11.4)
The figures are based on where the incidents occurred, not where they were reported from.
The photos are for illustrative purposes only and figures do not refer to any individual buildings or streets.
Take a look at the gallery below and see where the hotspots are.

1. Worst neighbourhoods for criminal damage
The 13 Sheffield neighbourhoods with the worst records for incidents of criminal damage. This pictures shows a man removing graffiti from a wall in the city. Photo: Iconic Media | Iconic Media Photo: Iconic Media

2. Burngreave & Grimesthorpe - 13th
Burngreave & Grimesthorpe saw 13.4 reports of criminal damage per 1,000 residents from September 2024 to August 2025, the 13th worst figure in Sheffield. The total number of incidents in that neighbourhood was 178 Photo: Google | Google Photo: Google
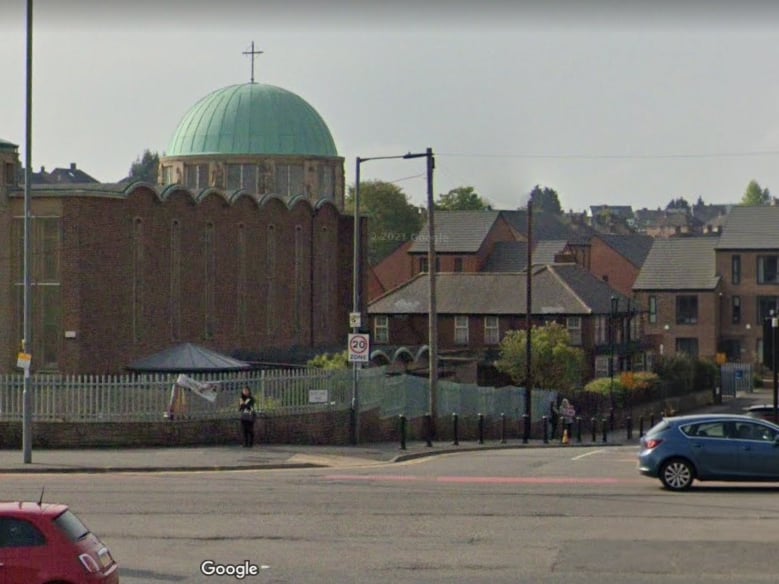
3. Woodthorpe - 12th
Woodthorpe saw 13.6 reports of criminal damage per 1,000 residents from September 2024 to August 2025, the 12th worst figure in Sheffield. The total number of incidents in that neighbourhood was 162 Photo: Google | Google Photo: Google

4. Devonshire Quarter - 11th
Devonshire Quarter saw 14.2 reports of criminal damage per 1,000 residents from September 2024 to August 2025, the 11th worst figure in Sheffield. The total number of incidents in that neighbourhood was 124 Photo: Google | Google Photo: Google