
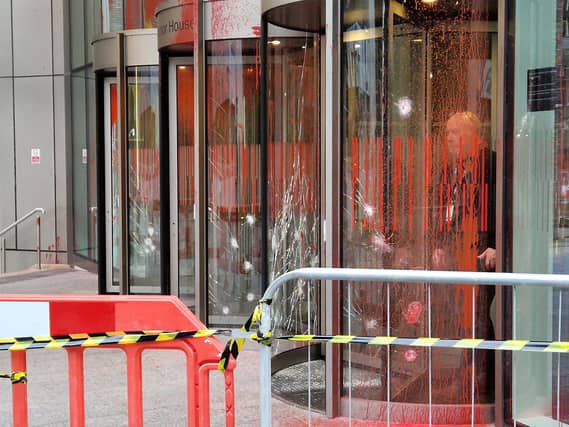


Official figures issued by Police UK show the neighbourhoods which have seen the most incidents, according to the most recent figures, which cover December 2024 to the end of November 2025.
The figures are divided into 70 separate Sheffield neighbourhoods across the city, and the gallery below shows the 25 of these which saw the most reports of vandalism.
The figures are for what is officially termed criminal damage, and they also include reports of arson.
They show the total number of reports of neighbourhood-level incidents of criminal damage, and the number as a rate per 1,000 residents. We have ranked the areas on the basis of the cases per 1,000 residents.
Sheffield as a whole saw 5,056 cases reported over the 12 month period, which works out at 8.7 incidents per 1,000 people.
The figures are based on where the incidents occurred, not where they were reported from.
The photos are for illustrative purposes only and figures do not refer to any individual buildings or streets.
Take a look at the gallery below and see where the hotspots are.
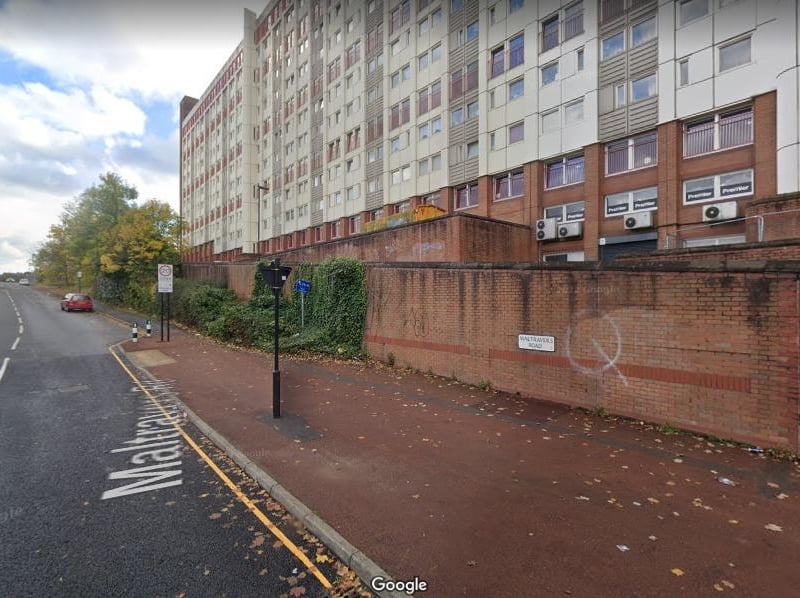
25. Park Hill & Wybourn - second
Park Hill & Wybournsaw 19.4 reports of criminal damage per 1,000 residents from December 2024 to November 2025, the second worst figure in Sheffield. The total number of incidents in that neighbourhood was 259. Photo: Google Photo: Google
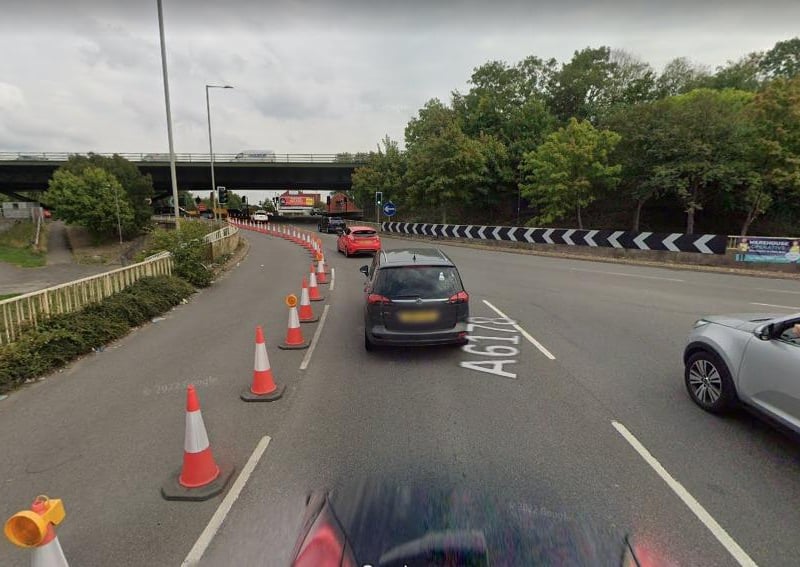
26. Tinsley and Carbrook - worst figure for criminal damage
Tinsley & Carbrook saw 22.8 reports of criminal damage per 1,000 residents from December 2024 to Novemer 2025, the worst figure in Sheffield. The total number of incidents in that neighbourhood was 160 Photo: Google Photo: Google