
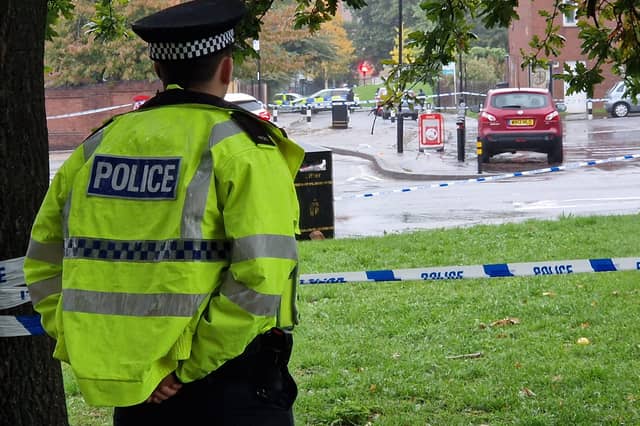


The figures are from Police UK figures representing the period from March 2025 until February 2026.
The numbers show reports of crime of all descriptions to South Yorkshire Police over that period in each of 70 areas into which the city has been divided up into.
In each case, the figure used in the ranking is the number of crimes per 1,000 residents in that neighbourhood. But we have also included the figure for the overall number of robberies in that neighbourhood.
The Star has taken those figures and created a gallery showing which parts of the city those figures suggest you are most likely to fal victim to a crime.
The city is divided up into 70 neighbourhoods in the figures which form the basis of the rankings. The figures are based on where the robberies occurred, not where they were reported from.
The photos are for illustrative purposes only and figures do not refer to any individual buildings or streets.
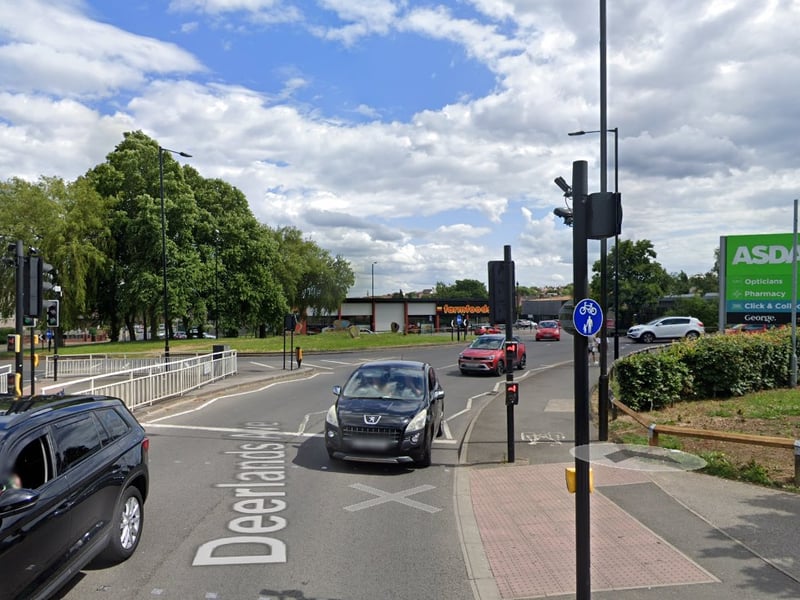
5. Parson Cross - 17th
Parson Cross saw 130.2 reported crimes per 1,000 residents from March 2025 to February 2026, the 17th highest figure in Sheffield. The total number of incidents in that neighbourhood was 1,406 . Photo: Google | Google
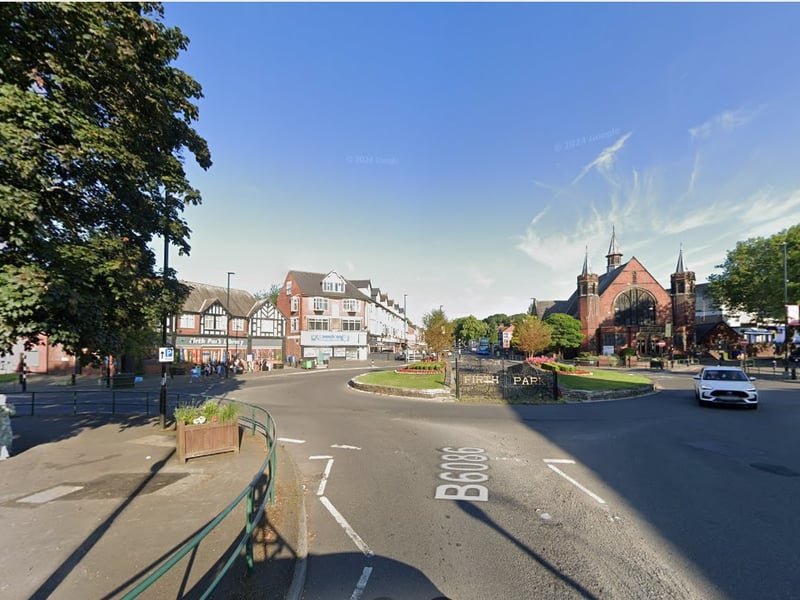
6. Firth Park - 16th
Firth Park saw 130.2 reported crimes per 1,000 residents from March 2025 to February 2026, the 16th highest figure in Sheffield. The total number of incidents in that neighbourhood was 1,117. Photo: Google | Google
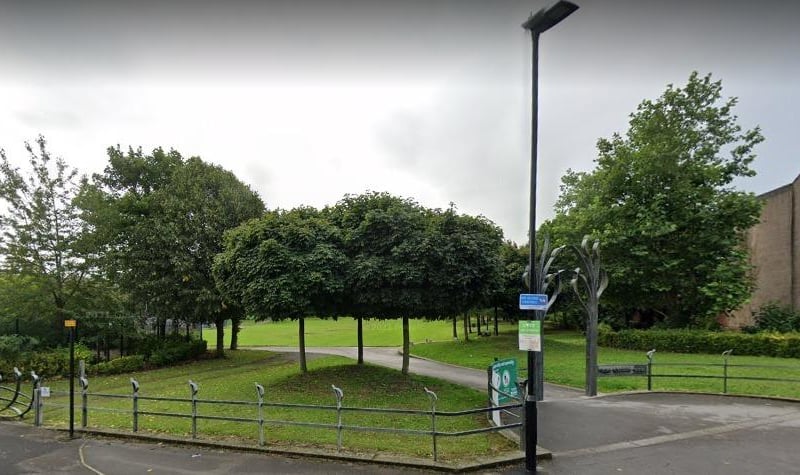
7. Sharrow - 15th
Sharrow saw 134.4 reported crimes per 1,000 residents from March 2025 to February 2026, the 15th highest figure in Sheffield. The total number of incidents in that neighbourhood was 1,338. Photo: Google | Local Library
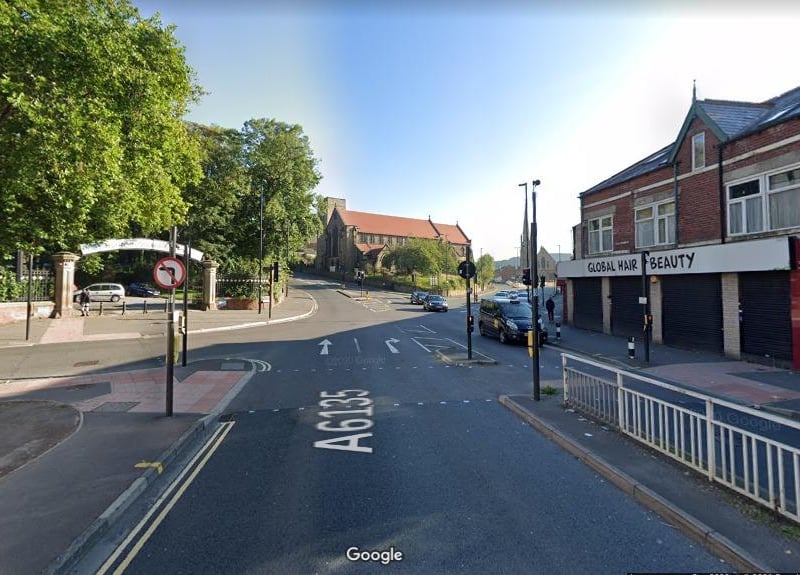
8. Crabtree & Fir Vale - 14th
Crabtree & Fir Vale saw 143.3 reported crimes per 1,000 residents from March 2025 to February 2026, the 14th highest figure in Sheffield. The total number of incidents in that neighbourhood was 1,399. Photo: Google | Local Library