


The clocks went back on Sunday morning, and South Yorkshire Police has urged people to take simple security steps like parking their cars in a well-lit streets and using a steering wheel lock, with an appeal over their social media channels calling for people to be careful. You can find their tips here.
And today we reveal the 28 parts of Sheffield which have the worst record in terms of vehicle crime over the year. The full list is in the gallery below.
Our gallery shows the neighbourhoods in the city which have seen the highest numbers of incidents of car crime over the most recent 12 month period for which figures are available - they are the figures for September 2023 to August 2024.
The figures look at incidents including both thefts of the cars or vehicles themselves, and incidents of thefts from cars.
These officially published figures have revealed the parts of the city which have seen the most complaints of vehicle crime.
Figures published on Sheffield Council’s ‘Local Insights’ information page gather the figures together for specific neighbourhoods.
The figures show total number of reports of neighbourhood-level incidents of vehicle crime, and the number as a rate per 1,000 residents.
We have ranked the figures by the number of reports per 1,000 residents, but also include the total number of incidents.
In total, the city has been split into 70 neighbourhoods in the figures.
The figures are based on where the incidents occurred, not where they were reported from.
We have listed the 28 neighbourhoods in the city with the largest number of vehicle crime incidents in the gallery below. The smaller number of incidents per person are at the top, and the area with the largest number is listed last.
The photos are for illustrative purposes only and figures do not refer to any individual buildings or streets.
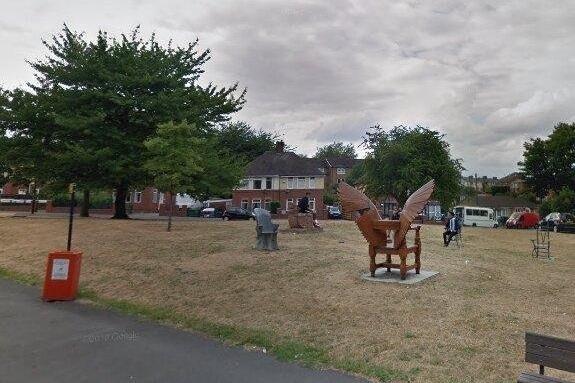
13. 17th: Brightside & Wincobank
17th: Brightside & Wincobank had 10.6 neighbourhood-level incidents of vehicle crime per 1,000, residents and a total of 101 overall. Photo: Google Photo: Google Maps
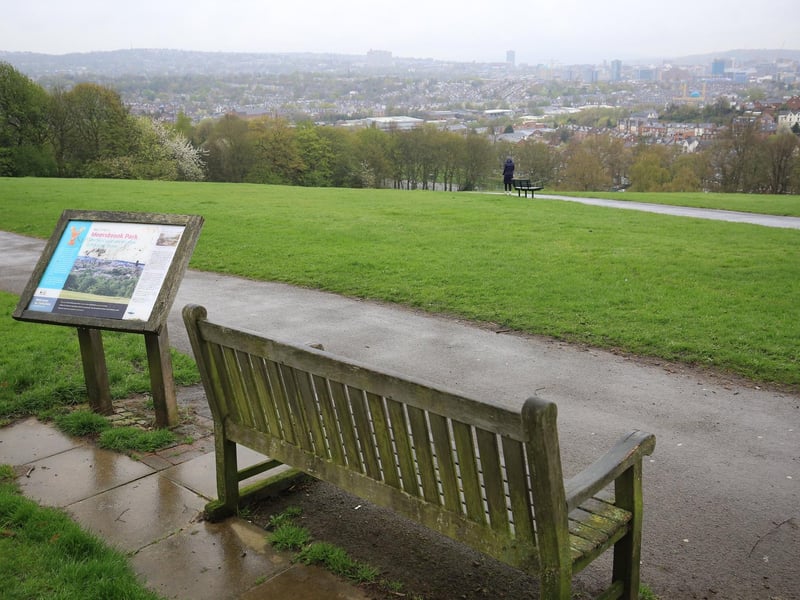
14. 16th: Meersbrook
16th: Meersbrook had 10.7 neighbourhood-level incidents of vehicle crime per 1,000, residents and a total of 79 overall. Photo: Marie Caley Photo: Marie Caley
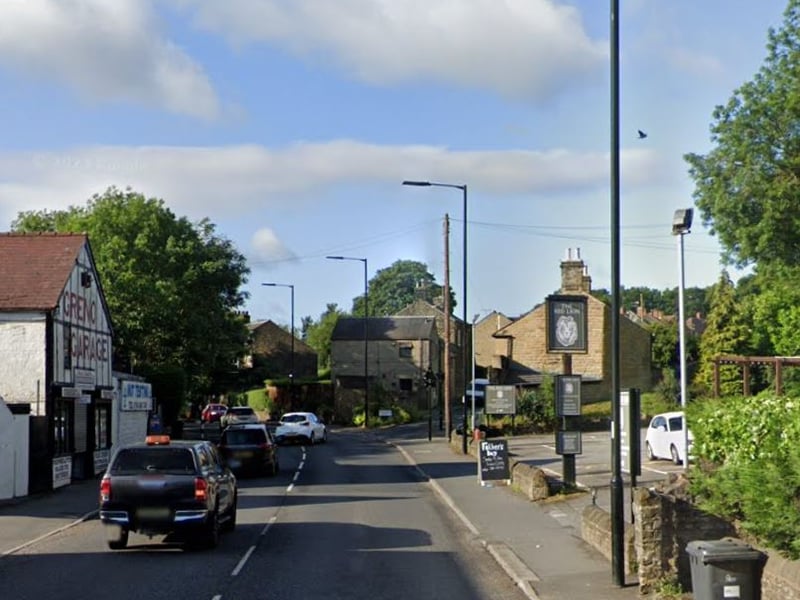
15. 23rd: Grenoside & Ecclesfield North
15th: Grenoside & Ecclesfield North had 11.2 neighbourhood-level incidents of vehicle crime per 1,000, residents and a total of 80 overall. Photo: Google | Google Photo: Google
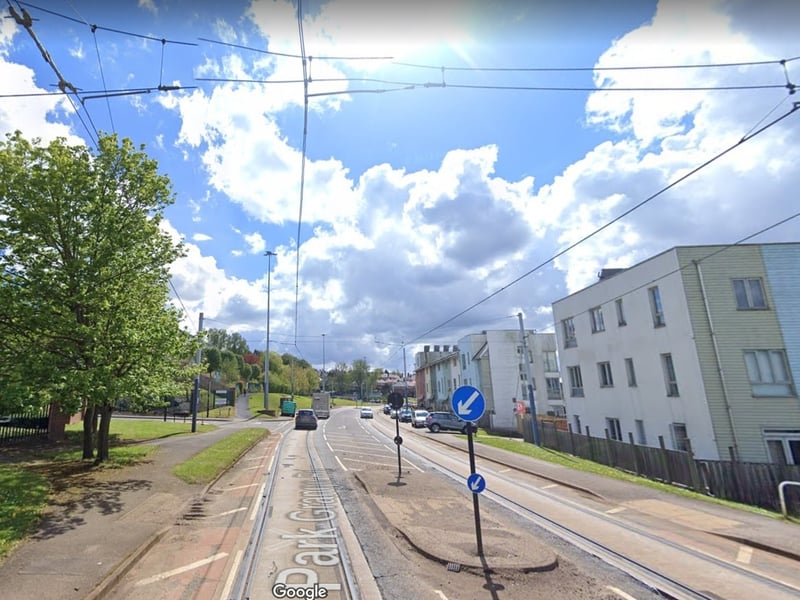
16. 14th: Arbourthorne
14th: Arbourthorne had 11.4 neighbourhood-level incidents of vehicle crime per 1,000, residents and a total of 61 overall. Photo: Google | Google Photo: Google