


They have been ranked using Police UK figures, which have been divided into 70 separate neighbourhoods across the city.
And these are the 14 of those neighbourhoods which showed the fewest reports of vehicle crime per head in the year between the start of September 2024 and the end of August 2025, the most recent available at time of writing.
The figures look at incidents including both thefts of the cars or vehicles themselves, and incidents of thefts from cars.
We have included both the total number of reports of neighbourhood-level incidents of vehicle crime, and the number as a rate per 1,000 residents.
For more stories like this and all of the latest news, current events and sport from across Sheffield and South Yorkshire, sign up for The Star’s daily newsletter
The photos are for illustrative purposes only and figures do not refer to any individual buildings or streets.
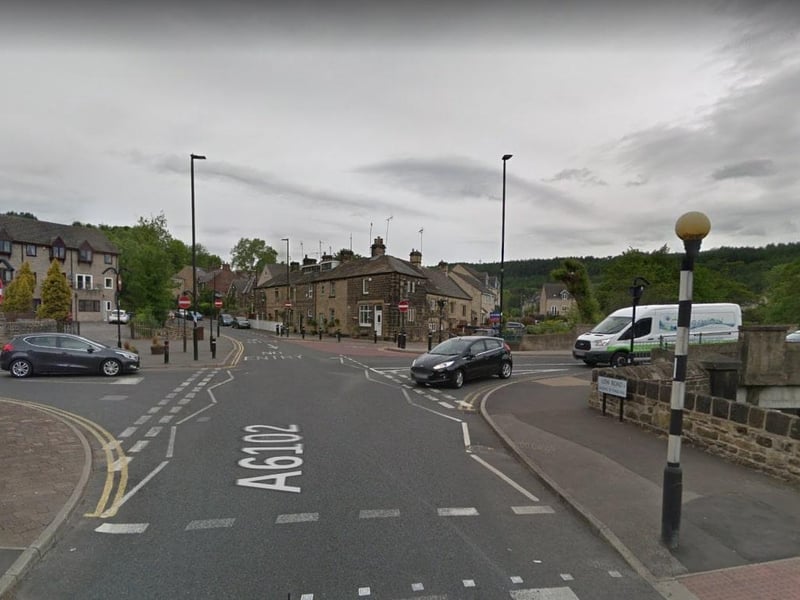
5. Oughtibridge and Bradfield - 11th lowest
Oughtibridge & Bradfield saw 4.2 reports of incidents of vehicle crime per 1,000 residents from September 2024 to August 2025,, the 11th lowest figure in Sheffield. The total number of incidents in that neighbourhood was 42. Photo: Google Photo: Google
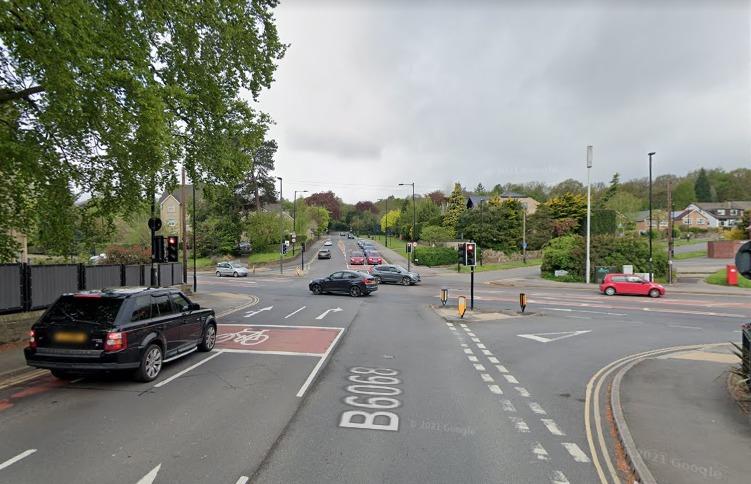
6. Beauchief - 10th lowest
Beauchief saw 4.2 reports of incidents of vehicle crime per 1,000 residents from September 2024 to August 2025, the 10th lowest figure in Sheffield. The total number of incidents in that neighbourhood was 25. Photo: Google Photo: Google

7. Dore & Whirlow - ninth lowest
Dore & Whirlow saw 4.1 reports of incidents of vehicle crime per 1,000 residents from September 2024 to August 2025, the ninth lowest figure in Sheffield. The total number of incidents in that neighbourhood was 44. Photo: Google | Google Photo: Google
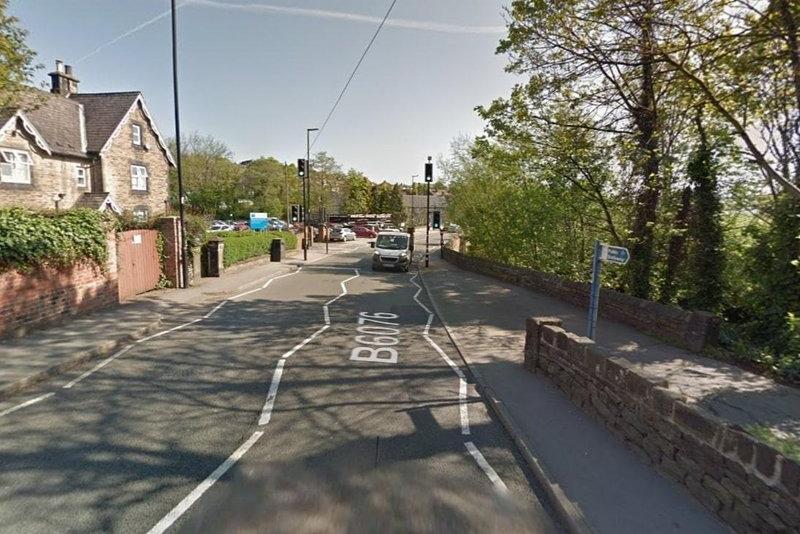
8. Malin Bridge & Wisewood - eighth lowest
Malin Bridge & Wisewood saw 4.1 reports of incidents of vehicle crime per 1,000 residents from September 2024 to August 2025, the eighth lowest figure in Sheffield. The total number of incidents in that neighbourhood was 31. Photo: Google Photo: Google Maps