


The figures are taken from ‘Local Insight’ figures for the city, which are based on South Yorkshire Police figures and divide the city into different neighbourhoods.
It means you can see the number of incidents in each of the 70 Sheffield neighbourhoods across the city, into which the figures are divided.
We have counted down the 21 areas with the fewest numbers of reports of violent crime or sexual assaults, as counted per 1,000 residents in that part of the city. That is the number we have used to rank them, and we list them in descending order from the 21st safest to the safest.
We have also included the total number of incidents of violent crime and sexual offences in each of those areas.
The pictures are for illustrative purposes only and do not indicate the location of any specific incident.
The figures are for the period from December 2023 until November 2024. Take a look at the gallery below to see where is safest.
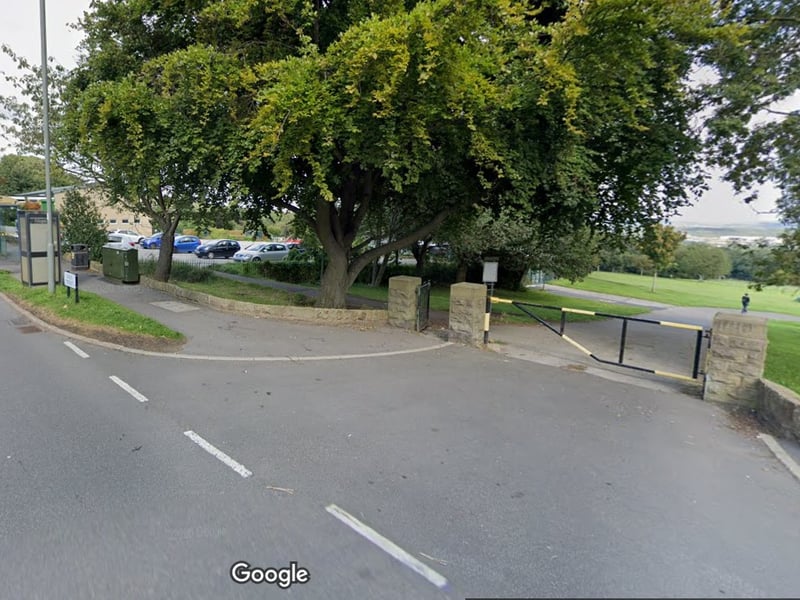
5. 18) Grenoside & Ecclesfield North
18) Grenoside & Ecclesfield North had 17.4 reports of violent crime or sexual offences per 1,000 population from December 2023 to November 2024, a total of 124 incidents overall. Photo: Google streetview | Google Photo: Google
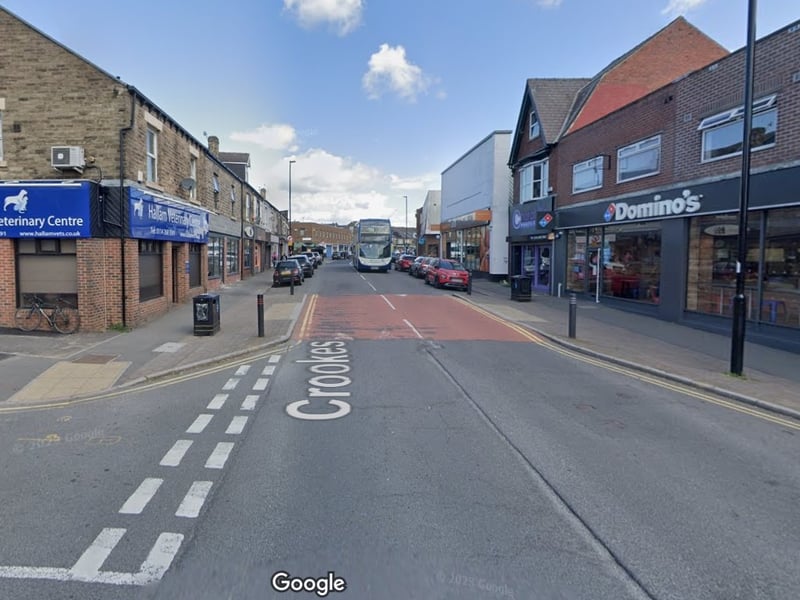
6. 17) Crookes
17) Crookes had 16.5 reports of violent crime or sexual offences per 1,000 population from December 2023 to November 2024, a total of 99 incidents overall. Photo: Google streetview | Google Photo: Google
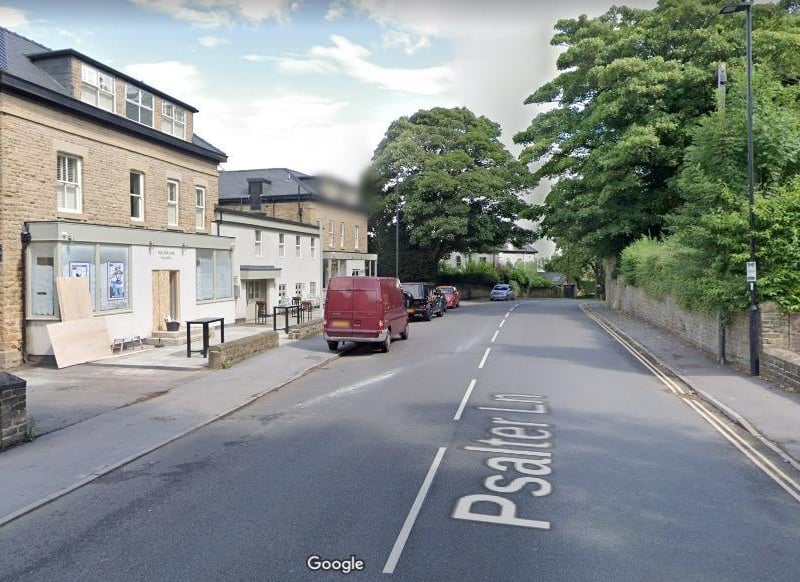
7. 16) Brincliffe & Sharrow Vale
16) Brincliffe & Sharrow Vale had 16.2 reports of violent crime or sexual offences per 1,000 population from December 2023 to November 2024, a total of 127 incidents overall. Photo: Google streetview Photo: Google
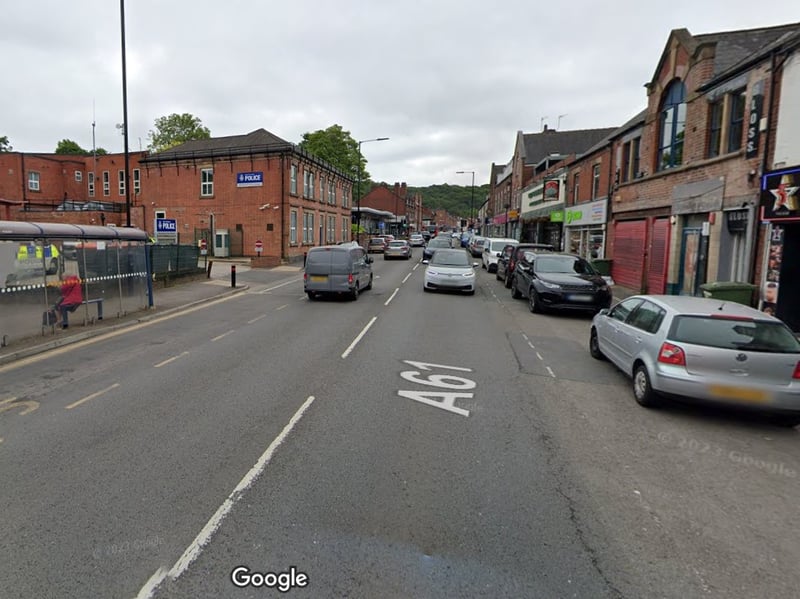
8. 15) Woodseats
15) Woodseats had 15.9 reports of violent crime or sexual offences per 1,000 population from December 2023 to November 2024, a total of 127 incidents overall. Photo: Google streetview | Google Photo: Google