


Figures from Police UK show that they saw the fewest reports of violent crime and sexual offences per 1,000 residents between September 2024 and the end of August 2025
We have taken the most up to date figures, which are recognised by Sheffield Council , and ranked them on the basis of the number of reports of incidents per 1,000 population in each of the 70 neighbourhoods of which Sheffield is officially divided up into by statistics experts.
Those 22 areas which saw the fewest complaints are listed in the gallery below, with the safest listed last.
The figures for violence do not include robberies, but do include sexual offences. The incidents are recorded in the area where they occurred.
The photos used in our gallery are for illustrative purposes only, and do not imply that a violent crime happened at that specific location.
Take a look at the gallery below to see where the worst hot spots were.
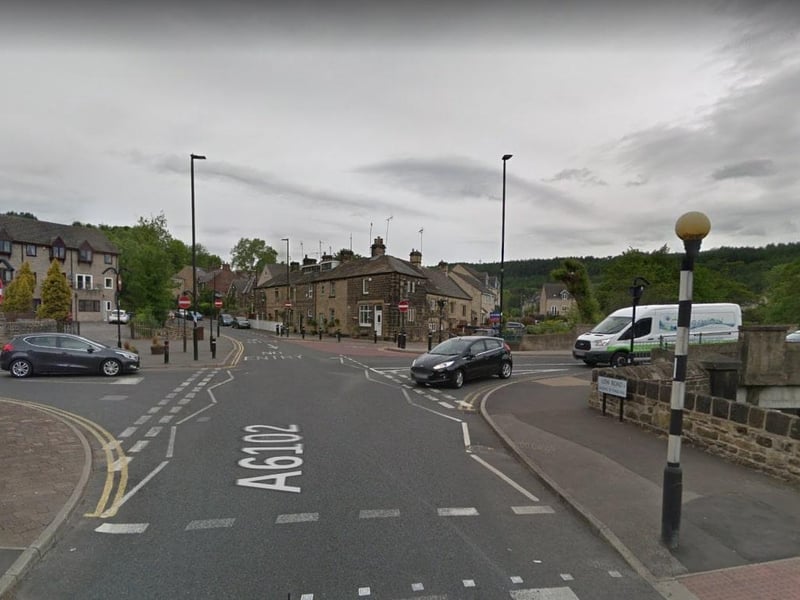
5. Oughtibridge and Bradfield - 19th lowest
Oughtibridge & Bradfield saw 18.4 reports of violent crime per 1,000 residents from September 2024 to August 2025, the 19th lowest figure in Sheffield. The total number of incidents in that neighbourhood was 183 Photo: Google Photo: Google

6. Google
Nether Edge saw 18.0 reports of violent crime per 1,000 residents from September 2024 to August 2025, the 18th lowest figure in Sheffield. The total number of incidents in that neighbourhood was 177 Photo: Google | Nether Edge - 18th lowest Photo: Google

7. Totley & Bradway - 17th lowest
Totley & Bradway saw 17.6 reports of violent crime per 1,000 residents from September 2024 to August 2025, the 17th lowest figure in Sheffield. The total number of incidents in that neighbourhood was 137. Photo: Google | Google Photo: Google
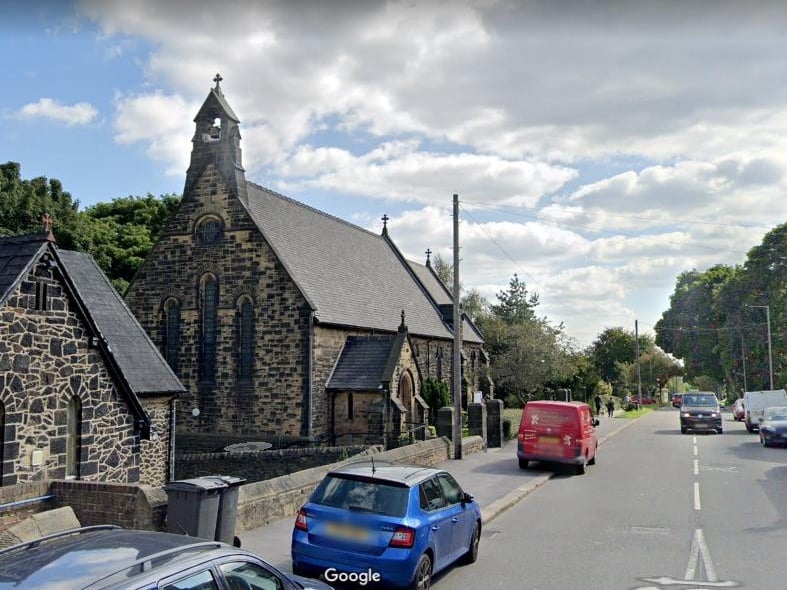
8. Grenoside & Ecclesfield North - 16th lowest
Grenoside & Ecclesfield North saw 16.8 reports of violent crime per 1,000 residents from September 2024 to August 2025, the 16th lowest figure in Sheffield. The total number of incidents in that neighbourhood was 120. Photo: Google Photo: Google