
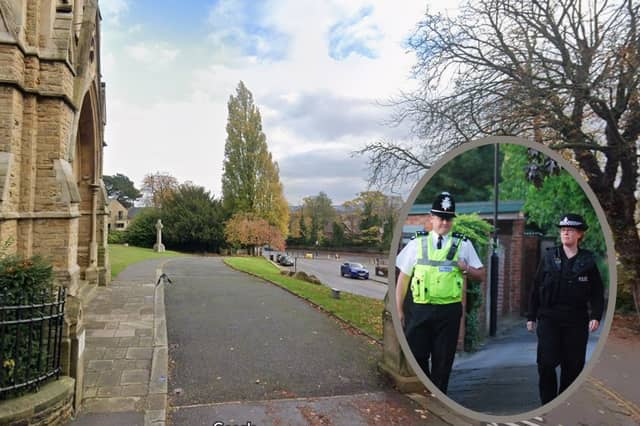


We have taken figures from Sheffield Council’s Local Insights statistics, to work out the areas of the city which have best managed to avoid the attention of vandals.
The numbers show the parts of the city where the reports made to South Yorkshire Police for criminal damage and arson are the lowest.
They are based on police crime figures for the year December 2023 to November 2024, , so are, largely, the figures from 2024, but they have been divided into neighbourhoods by experts.
The figures show both the total number of reports of neighbourhood-level incidents of criminal damage and arson, and the number as a rate per 1,000 residents.
We have ranked the figures by the number of reports per 1,000 residents in each of those neighbourhoods. It means the place that tops the list for steering clear of vandalism here is the place with the fewest incidents per person living there. Where those numbers are equal, we have taken into account the total number of offences overall in that area.
In total, the city has been split into 70 neighbourhoods in the figures, and the numbers are based on where the incidents occurred, not where they were reported from.
We have listed the 21 neighbourhoods in the city with the fewest incidents of criminal damage in the gallery below, with the larger number of incidents per person at the top, and the area with the fewest reports per resident in the whole of the city listed last.
The photos are for illustrative purposes only and figures do not refer to any individual buildings or streets.

9. Google
14th: Nether Edge had 3.5 neighbourhood-level incidents of criminal damage per 1,000 residents and a total of 34 overall. Photo: Google | 14th: Nether Edge Photo: Google
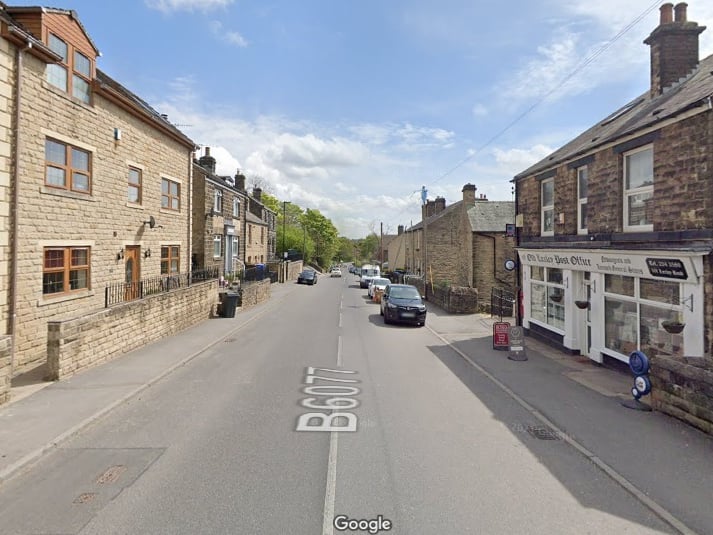
10. 13th: Upper Stannington & Loxley
13th: Upper Stannington & Loxley had 3.5 neighbourhood-level incidents of criminal damage per 1,000 residents and a total of 27 overall. Photo: Google | Google Photo: Google
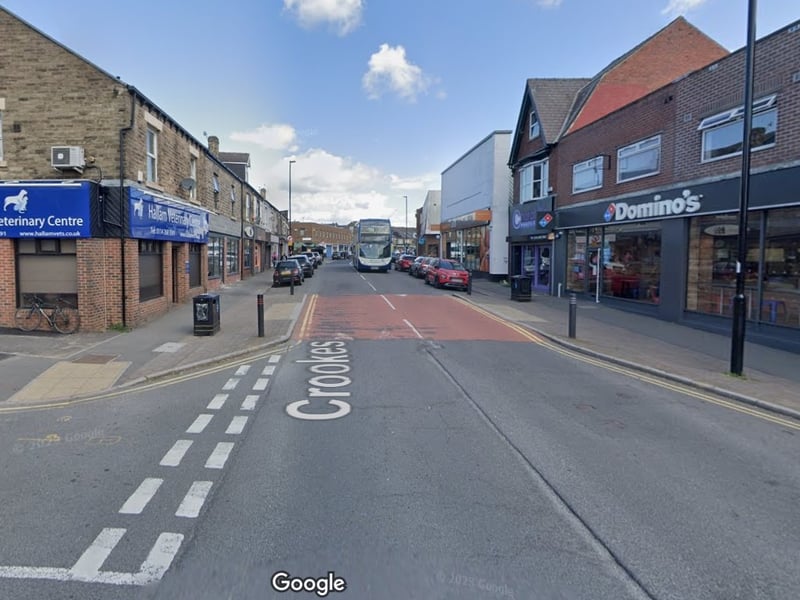
11. 12th: Crookes
12th: Crookes had 3.3 neighbourhood-level incidents of criminal damage per 1,000 residents and a total of 20 overall. Photo: Google | Google Photo: Google
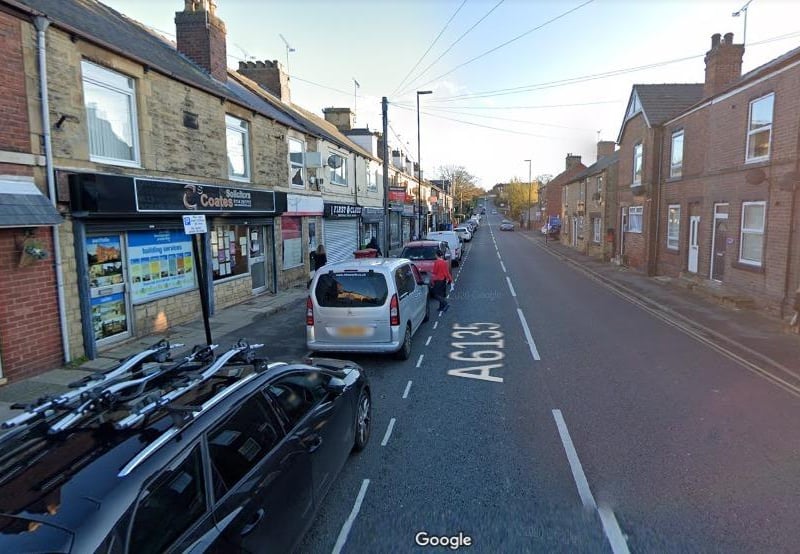
12. 11th: Mosborough & Halfway
11th: Mosborough & Halfway had 3.2 neighbourhood-level incidents of criminal damage per 1,000 residents and a total of 30 overall. Photo: Google Photo: Google