
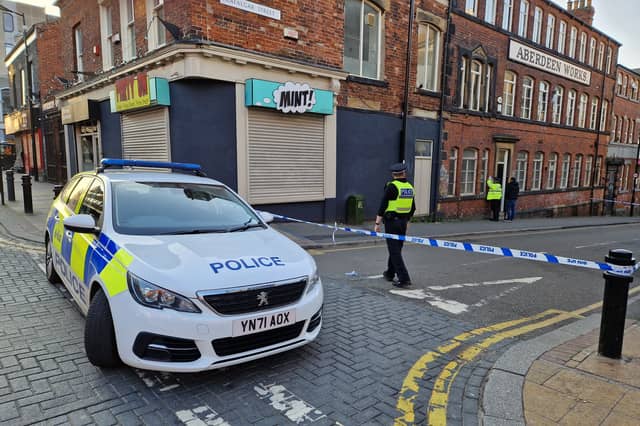


Sheffield is divided into 70 neighbourhoods, and those in our gallery below have been shown to have the most crimes per head of population in the city.
We have ranked them on this number, but have also includes the total number of offences in those areas.
They are based on Police UK figures showing the total number of reports of crimes of all descriptions made in the city between the start of September 2024 and the end of August 2025.
The average for the city was 117 crimes per 1,000 people, and a total of 66, 276 crimes overall.
In other major cities the figure was 129.9 in Birmingham, 140.0 in Bristol, 134.0 in Leeds, 138.4 in Liverpool. 145.4 in Newcastle, and 143.7 in Nottingham.
The national figure for England as a whole was 93.8 crimes per 1,000 residents.
Pictures are for illustrative purposes only and do not refer to any specific incidents.

17. Norfolk Park - eighth
Norfolk Park saw 183.6 crimes per thousand households from September 2024 to August 2025, the eighth worst figure. The total number of crimes reported in that neighbourhood was 1,406. Photo: Google | Google Photo: Google
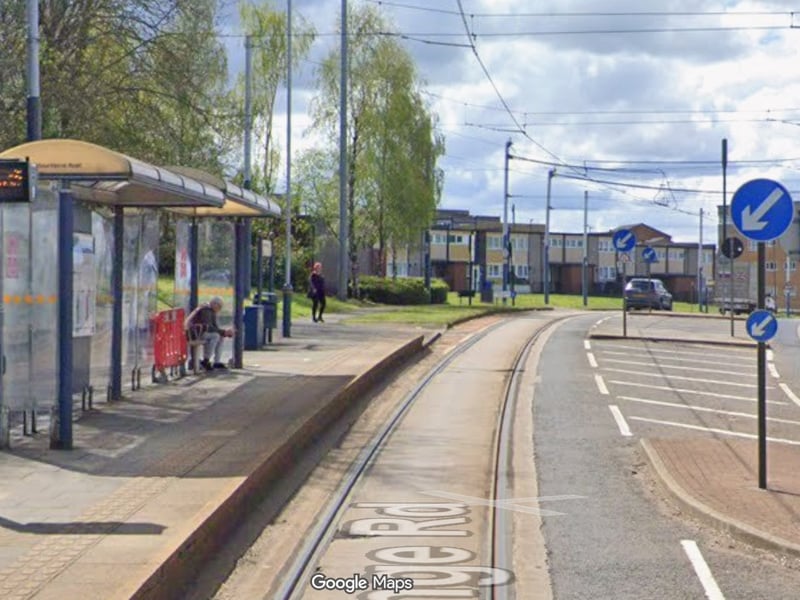
18. Arbourthorne - seventh
Arbourthorne saw 186.4 crimes per thousand households from September 2024 to August 2025, the seventh worst figure. The total number of crimes reported in that neighbourhood was 997. Photo: Google | Google Photo: Google
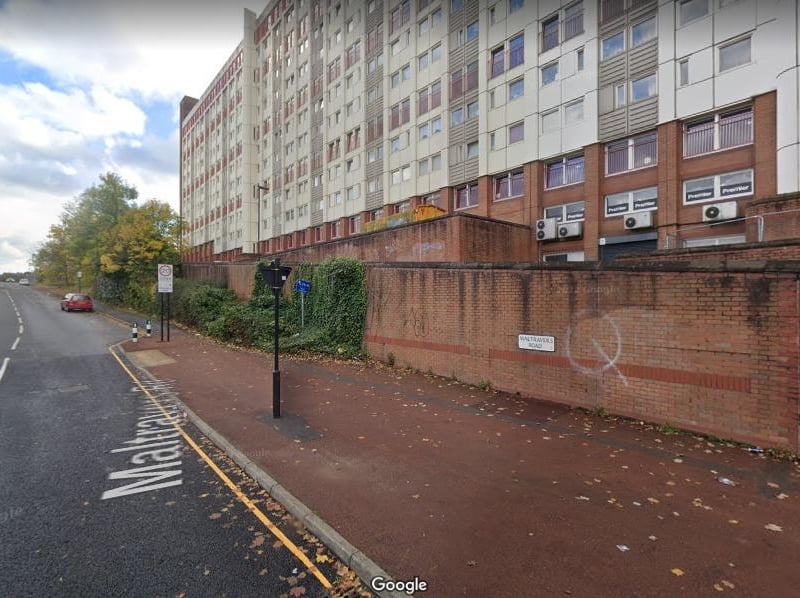
19. Park Hill & Wybourn - sixth
Park Hill & Wybourn saw 197.4 crimes per thousand households from September 2024 to August 2025, the sixth worst figure. The total number of crimes reported in that neighbourhood was 2,449. Photo: Google Photo: Google
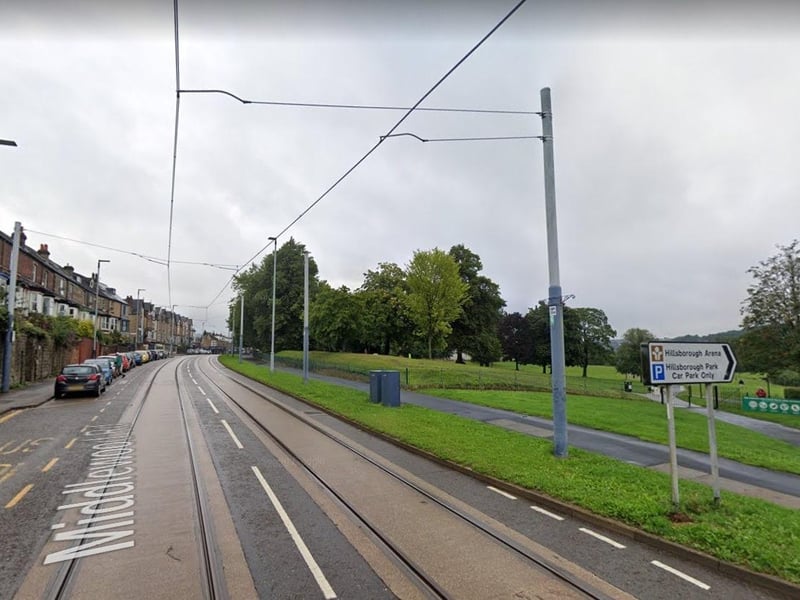
20. Hillsborough, Owlerton & Wadsley Bridge - fifth
Hillsborough, Owlerton & Wadsley Bridge saw 218.9 crimes per thousand households from September 2024 to August 2025, the fifth worst figure. The total number of crimes reported in that neighbourhood was 1,321. Photo: Google Photo: Google