


Statistics for the 12 month period from March 2024 until February 2025 reveal that there were 4,508 reports of vehicle crime across the city over that time.
Our gallery, below, shows the 21 neighbourhoods which have the worst figures for vehicle crime in Sheffield over that period.
The are taken from police crime figures, for each of 70 neighbourhoods into which the city is divided into.
You can see the full list below, ranked from the 21st highest figure, to the highest overall in the city as a whole.
The figures look at incidents including both thefts of the cars or other types of vehicles themselves, and incidents of thefts of items from cars.
Our figures show both the total number of reports of neighbourhood-level incidents of vehicle crime, and the number as a rate per 1,000 residents.
We have ranked the figures by the number of reports per 1,000 residents. If those two neighbourhoods were equal, we took into account the overall number for the neighbourhood.
The figures are based on where the incidents occurred, not where they were reported from.
The photos are for illustrative purposes only and figures do not refer to any individual buildings or streets.
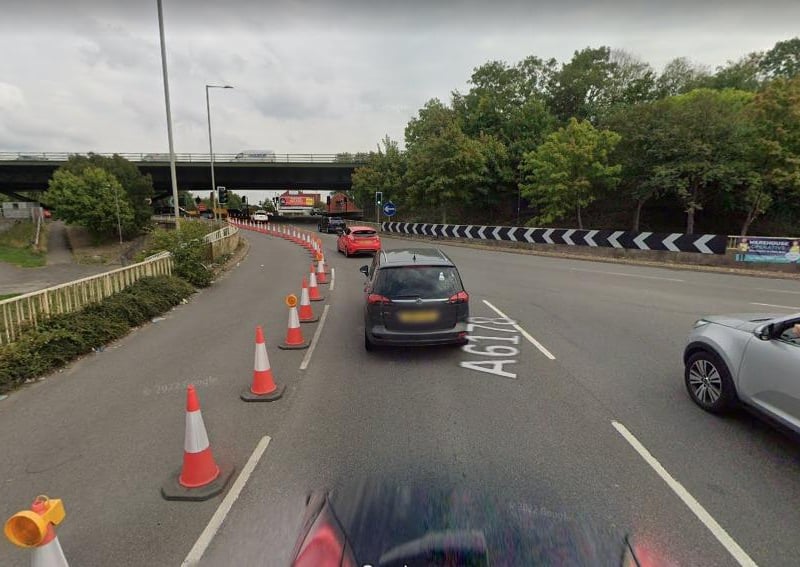
21. Tinsley and Carbrook: Third
Third: Tinsley & Carbrook had 23.1 neighbourhood-level incidents of vehicle crime per 1,000 residents and a total of 153 overall. Photo: Google Photo: Google

22. Burngreave & Grimesthorpe: Most vehicle crime
Burngreave & Grimesthorpe had the worst levels of vehicle crime, with 23.8 neighbourhood-level incidents per 1,000 residents and a total of 300 overall. Photo: Google | Google Photo: Google