

They are the parts of Sheffield where burglars have struck the most over 12 months- and today we list them.
We have used figures taken from Sheffield Council statistics , in turn based on official police numbers, and which break down burglaries in the city into specific neighbourhoods.
In each case, the figure is the number of break-ins per 1,000 households in that neighbourhood.
The Star has taken those figures and created a gallery showing which parts of the city those figures suggest you are most likely to be burgled.
The figures relate to a 12 month period from March 2023 to February 2024.
And they are divided up into 70 neighbourhoods in the council figures. The figures are based on where burglaries occurred, not where they were reported from.
We have listed the 23 neighbourhoods in the city with the largest number of reported burglaries in the gallery below, with the smaller number of burglaries per person at top, and the area with the largest number listed last.
The photos are for illustrative purposes only and figures do not refer to any individual buildings or streets.
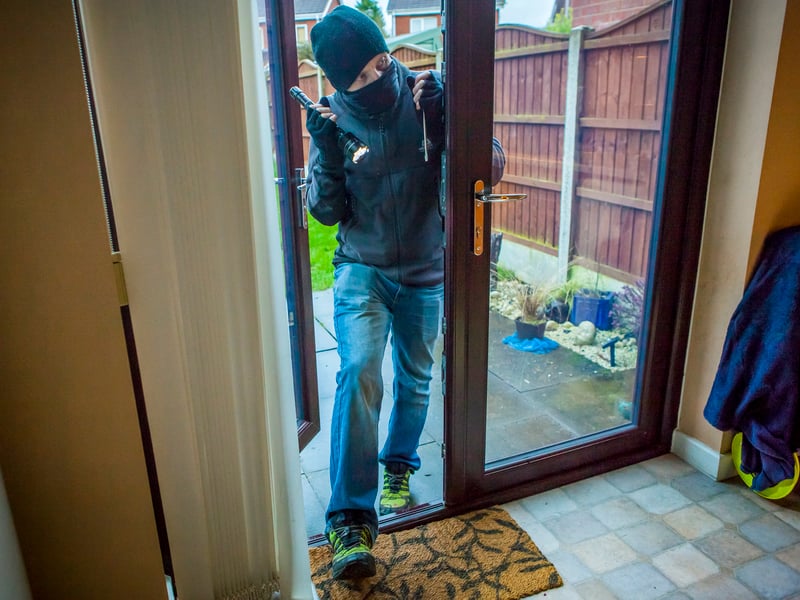
1. Burglaries
These are the neighbourhoods in Sheffield which reported the most burglaries per head of population in the year from March 2023 to February 2024. Photo: National World | National World Photo: Marisa Cashill
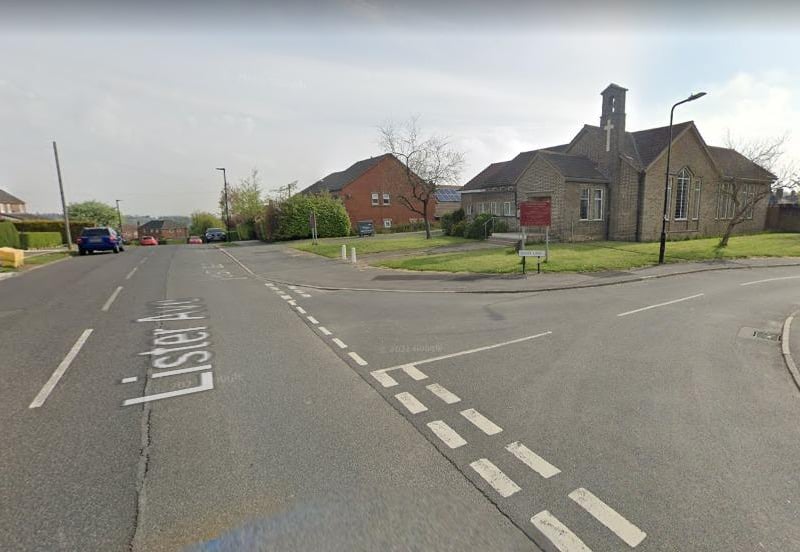
2. 23. Charnock & Basegreen
23. Charnock & Basegreen had a 12 month total of 30.4 neighbourhood-level burglaries, and as a rate per 1,000 households Photo: Google
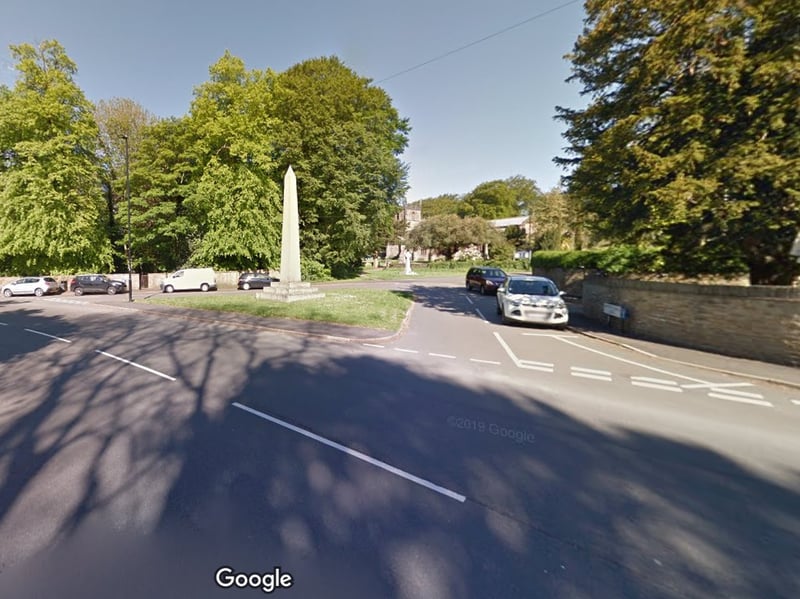
3. 22. Norton & Norton Lees
22. Norton & Norton Lees had a 12 month total of 30.9 neighbourhood-level burglaries, and as a rate per 1,000 households Picture Google | Google Photo: Google
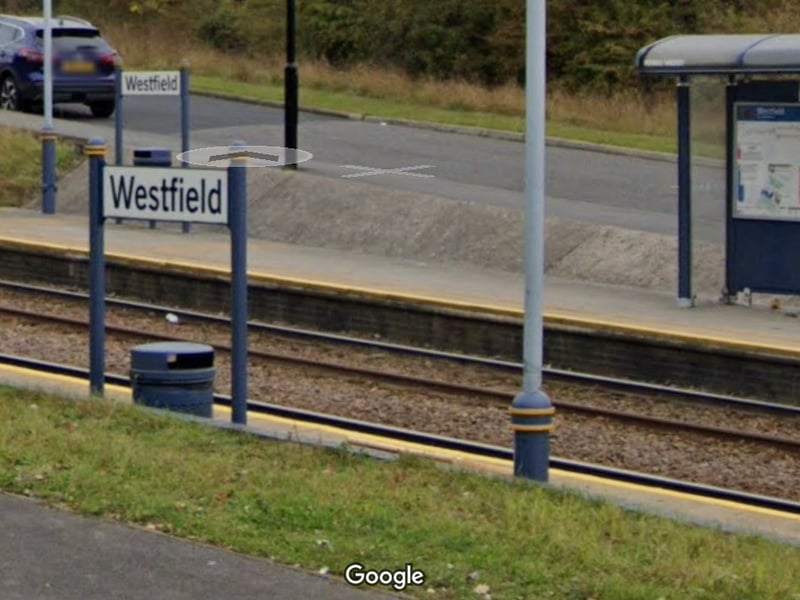
4. 21. Westfield & Waterthorpe
21. Westfield & Waterthorpe had a 12 month total of 31.2 neighbourhood-level burglaries, and as a rate per 1,000 households. Photo: Google | Google Photo: Google