
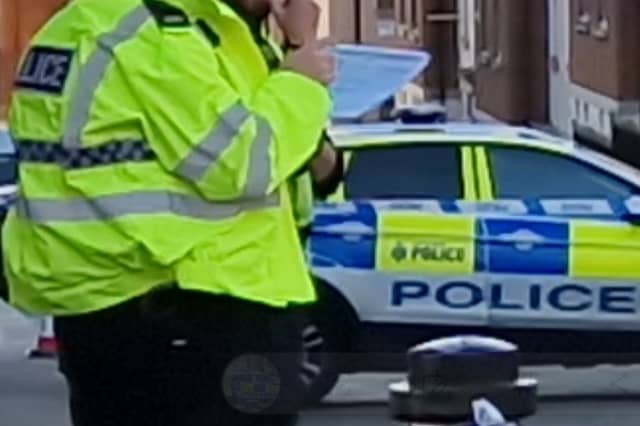


Statistics from Police UK show the neighbourhoods of Sheffield which have seen the most reports of incidents of criminal damage in the most recent time period available, which runs from June 2024 until May 2025.
They work on the basis of the city being divided into 70 neighbourhoods, and the figures are recognised by Sheffield Council.
The figures are for what is officially termed criminal damage, and they also include instances of arson.
They show the total number of reports of neighbourhood-level incidents of criminal damage, and the number as a rate per 1,000 residents. We have ranked the areas on the basis of the cases per 1,000 residents.
The figures are based on where the incidents occurred, not where they were reported from.
We have listed the 24 neighbourhoods in the city with the largest number of criminal damage incidents in the gallery below - with the smaller number of cases per person at top and the area with the largest number listed last.
The photos are for illustrative purposes only and figures do not refer to any individual buildings or streets.
Take a look at the gallery below and see where the hotspots are.
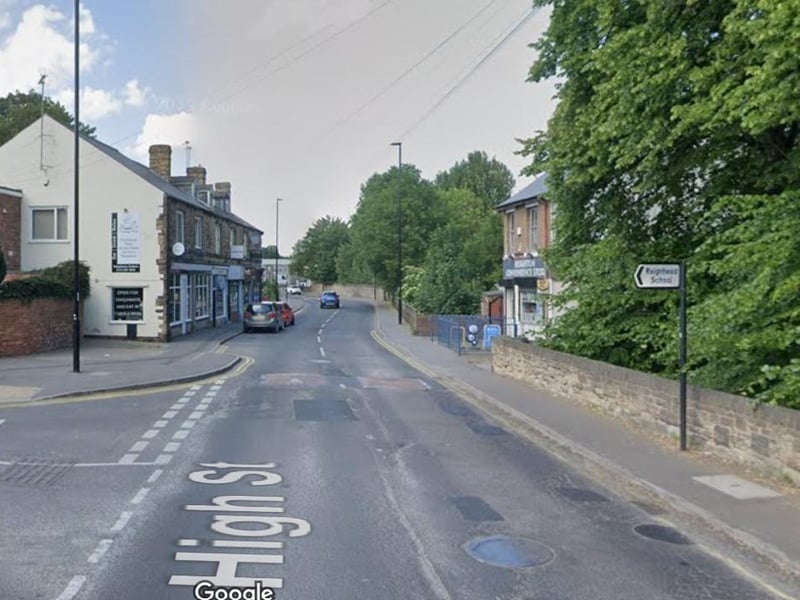
5. Beighton.jpg
Beighton saw 11.4 reports of criminal damage per 1,000 residents from June 2024 to May 2025, the 21st worst figure in Sheffield. The total number of incidents in that neighbourhood was 68 Photo: Google | Beighton - 21st Photo: Google
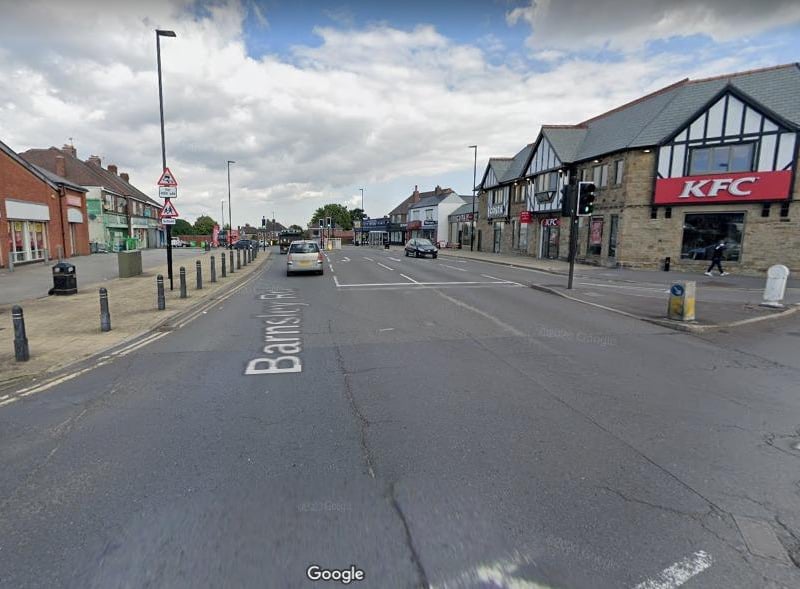
6. Sheffield Lane Top & Longley Park - 20th
Sheffield Lane Top & Longley Park saw 11.6 reports of criminal damage per 1,000 residents from June 2024 to May 2025, the 20th worst figure in Sheffield. The total number of incidents in that neighbourhood was 72 Photo: Google Photo: Google
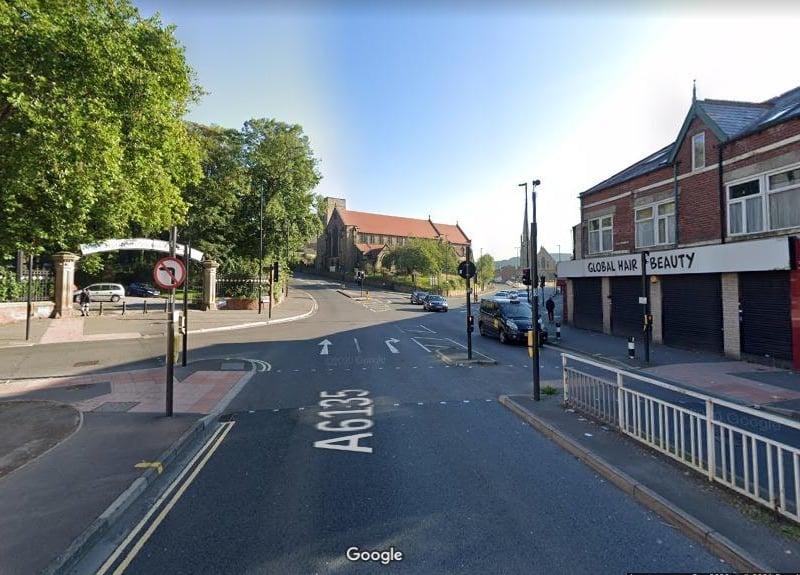
7. Crabtree & Fir Vale - 19th
Crabtree & Fir Vale saw 12.1 reports of criminal damage per 1,000 residents from June 2024 to May 2025, the 19th worst figure in Sheffield. The total number of incidents in that neighbourhood was 113 Photo: Google Photo: Google

8. Woodhouse West - 18th
Woodhouse West saw 12.4 reports of criminal damage per 1,000 residents from June 2024 to May 2025, the 18th worst figure in Sheffield. The total number of incidents in that neighbourhood was 74 Photo: Google | Google Photo: Google