


We have looked at the statistics to find the neighbourhoods in Sheffield which are nearest to being free of the problem.
South Yorkshire Police record complaints of anti-social behaviour, and they have been broken down into 70 separate neighbourhoods.
We have taken the figures showing the number of neighbourhood level complaints of anti-social behaviour per 1,000 households, and ranked the 21 areas with the least issues.
They are listed in descending order in the gallery below.
We have also included the total number of complaints in each of those neighbourhoods.
The figures represent the period from June 2024 to May 2025.
Crimes associated with anti-social behaviour include those relating to fireworks, neighbours, alcohol, nuisance motorbikes, and quad bikes or youth related offences.
All images are for illustrative purposes and do not represent a specific incident or location.
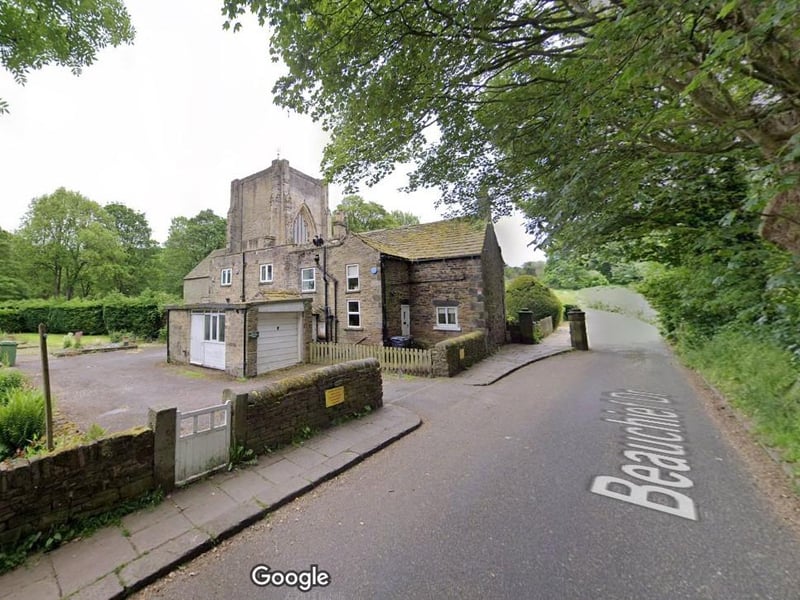
13. Beauchief - 10th
Beauchief saw 8.7 reports of antisocial behaviour per 1,000 residents from June 2024 to May 2025, the 10th lowest figure in Sheffield. The total number of incidents in that neighbourhood was 52. Photo: Google Photo: Google
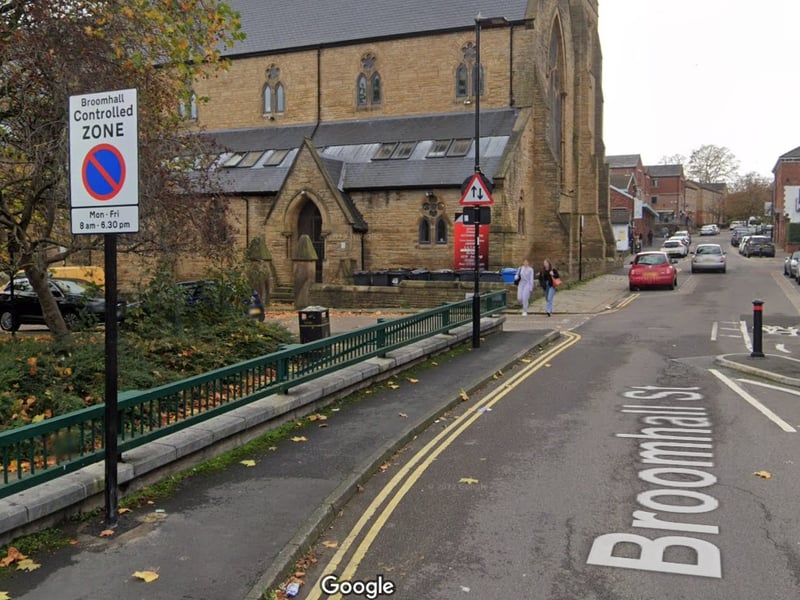
14. Broomhall - 9th
Broomhall saw 8.0 reports of antisocial behaviour per 1,000 residents from June 2024 to May 2025, the ninth lowest figure in Sheffield. The total number of incidents in that neighbourhood was 61. Photo: Google | Google Photo: Google
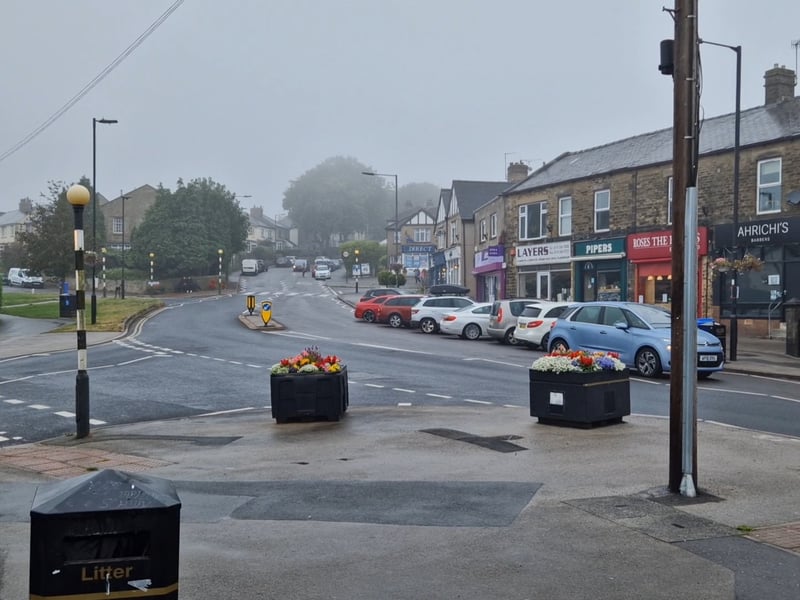
15. Sandygate & Crosspool - 8th
Sandygate & Crosspool saw 7.1 reports of antisocial behaviour per 1,000 residents from June 2024 to May 2025, the eighth lowest figure in Sheffield. The total number of incidents in that neighbourhood was 45. Photo: National World | National World Photo: David Kessen

16. Dore & Whirlow - 7th
Dore & Whirlowsaw 7.0 reports of antisocial behaviour per 1,000 residents from June 2024 to May 2025, the seventh lowest figure in Sheffield. The total number of incidents in that neighbourhood was 74. Photo: Google | Google Photo: Google