


Figures published by Police UK show they had more crimes per head of population than any other of the 70 neighbourhoods which make up the city in the statistics.
The figures are for the period from December 2024 until November 2025, and we have ranked them in the gallery below based on the crimes per 1,000 people there. We have also included the total number of offences in those areas.
They are based on Police UK figures showing the total number of reports of crimes of all descriptions.
The average for the city was 112.6 crimes per 1,000 people, and a total of 65,600 crimes overall.
Don’t miss out on the city’s biggest stories with our daily newsletter, which highlights the latest news. From breaking news to crime, business, local politics, sport and much more
In other major cities the figure was 125.0 in Birmingham, 138.9 in Bristol, 129.0 in Leeds, 135.6 in Liverpool, 138.0 in Newcastle, and 148.3 in Nottingham.
The national figure for England as a whole was 91.0 crimes per 1,000 residents.
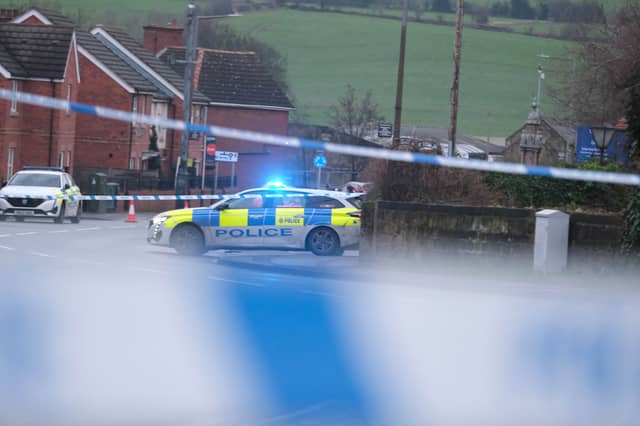
Pictures are for illustrative purposes only and do not refer to any specific incidents.
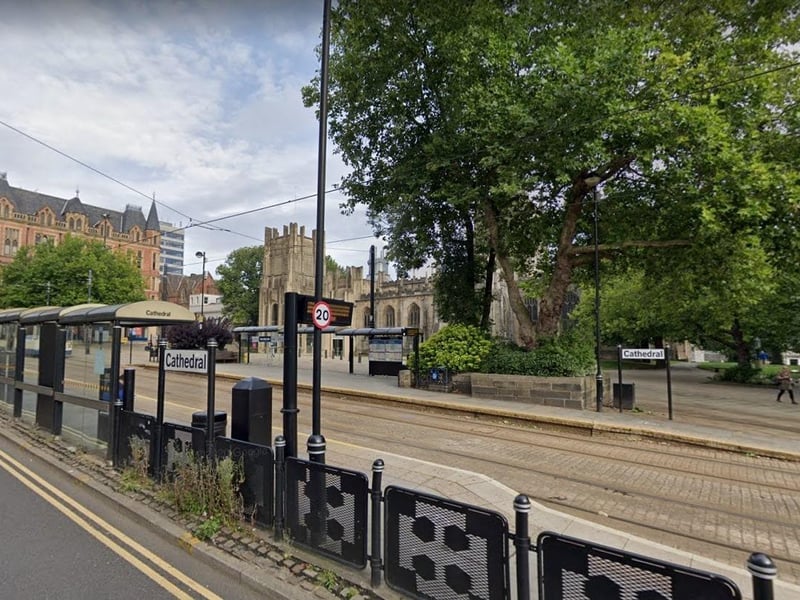
17. Cathedral & Kelham - Third
Cathedral & Kelham saw 302.7 crimes per thousand households from December 2024 to November 2025, the third worst figure. The total number of crimes reported in that neighbourhood was 4,195. Photo: Google Photo: Google
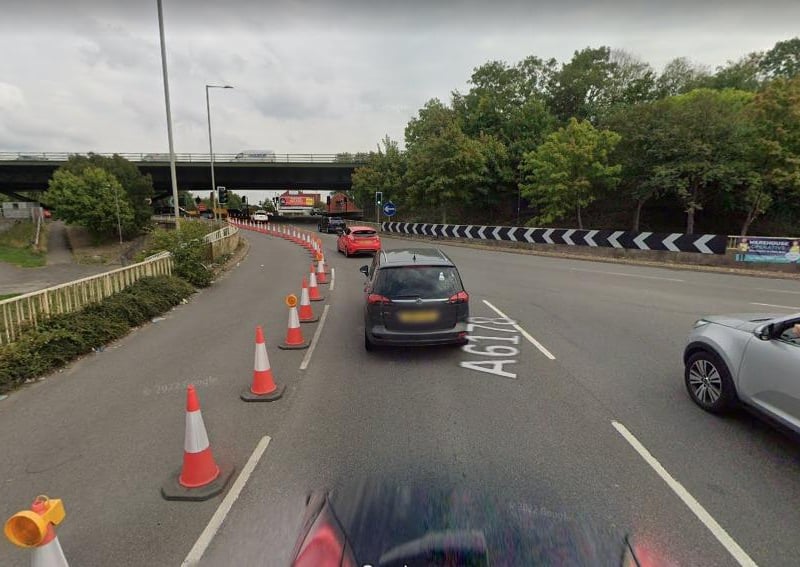
18. Tinsley and Carbrook - Second
Tinsley & Carbrook saw 366.4 crimes per thousand households from December 2024 to November 2025, the third worst figure. The total number of crimes reported in that neighbourhood was 2,568. Photo: Google Photo: Google

19. Devonshire Quarter - Highest number of crimes in Sheffield
Devonshire Quarter saw 381.9 crimes per thousand households from December 2024 to November 2025, the worst figure. The total number of crimes reported in that neighbourhood was 3,340. Photo: Google | Google Photo: Google