

Sheffield’s weekly infection rate for the seven days to August 2 – the latest date for which reliable figures are available – was 497.6 new cases per 100,000 people.
That’s up from 399.5 during the previous week, ending on July 26.
Across England as a whole, the Covid-19 case rate dropped during the same period, from 321.4 to 282.2.
Out of 70 neighbourhoods in Sheffield, there are only 17 in which the number of new cases fell during the latest week.
There were 14 where new cases rose by more than 50 per cent and three where they were up by over 100 per cent.
Latest figures also show that the number of people in Sheffield’s hospitals with coronavirus is continuing to rise, with 78 Covid patients as of August 3, 10 of whom were on mechanical ventilation.
These are the neighbourhoods within Sheffield where the Covid rate rose fastest during the week ending on August 2, according to government figures.
To view the latest Covid rates where you live on the interactive map, visit: https://coronavirus.data.gov.uk/details/interactive-map/cases.
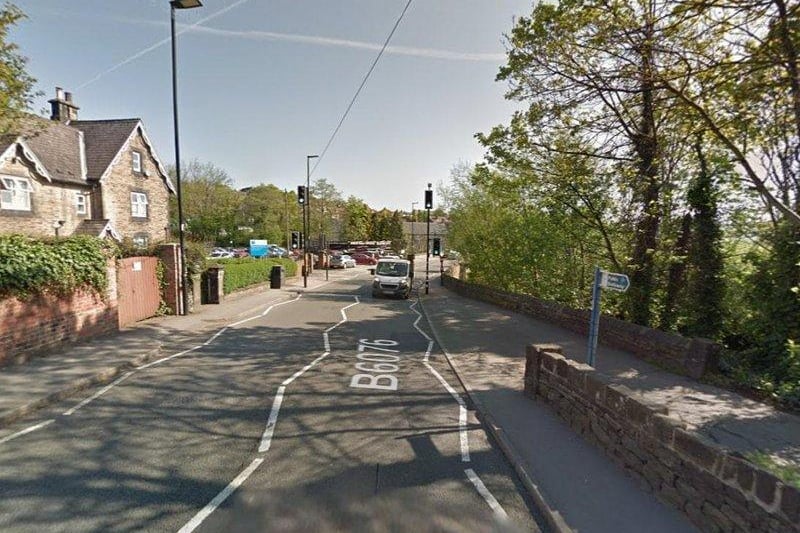
1. Malin Bridge & Wisewood
In Malin Bridge & Wisewood, the weekly Covid case rate rose by 247.6% during the week ending August 2, with 72 new cases recorded Photo: Google Maps
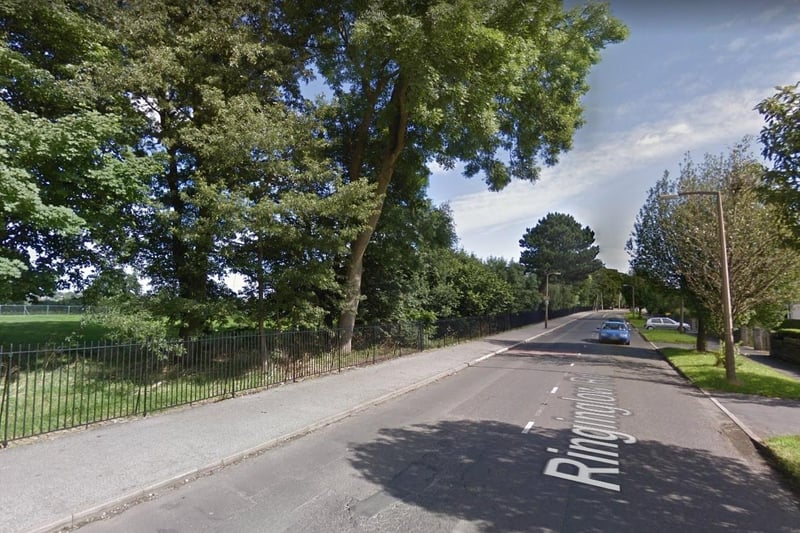
2. Bents Green & Millhouses
In Bents Green & Millhouses, the weekly Covid case rate rose by 146.7% during the week ending August 2, with 74 new cases recorded Photo: Google
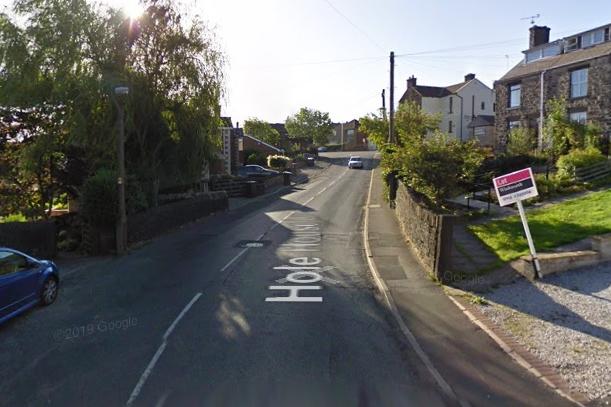
3. Stocksbridge
In Stocksbridge, the weekly Covid case rate rose by 129.4% during the week ending August 2, with 39 new cases recorded Photo: Google Maps
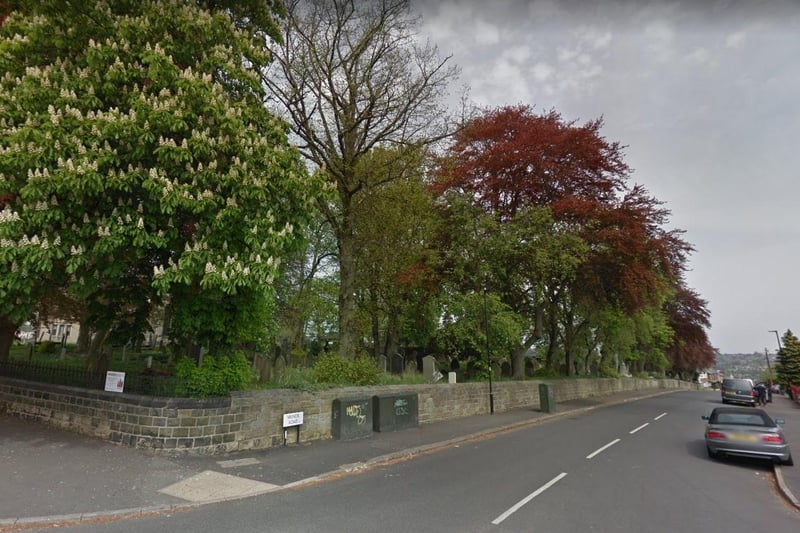
4. Wadsley & Marlcliffe
In Wadsley & Marlcliffe, the weekly Covid case rate rose by 90.5% during the week ending August 2, with 40 new cases recorded Photo: Google