
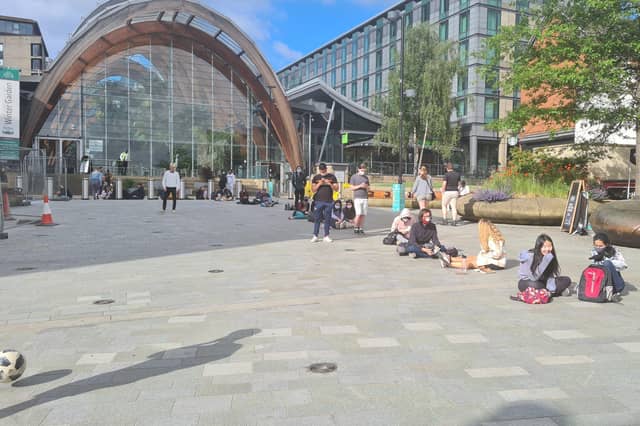


Covid cases rose in 38 out of Sheffield’s 70 neighbourhoods in the week to 6 August – the latest week on record.
And no neighbourhoods saw fewer than three cases in the latest week.
Here are the neighbourhoods in Sheffield where Covid cases rose the most in the seven days to 6 August.
Infection rates are given as the number of new cases in the week per 100,000 of the population.
- RELATED: "Strokely Come Dancing" returns to Sheffield after 10 years
- RELATED: Why Sheffield fruit fly population is surging in autumn - and what to do about them
- RELATED: Tiny white flies swarm Sheffield - this is why
- RELATED: 'Is Andy Burnham's dream of decent care for elderly so terrifying?' - Nancy Fielder
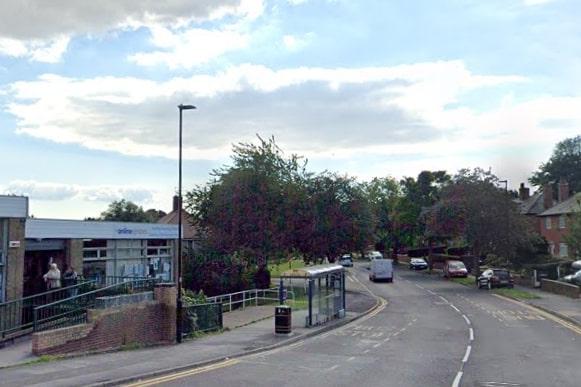
5. Southey Green East
In the week to August 6 the infection rate was 674.6, up from 458.2 the week before. This is a rise of 47 per cent. Photo: Google
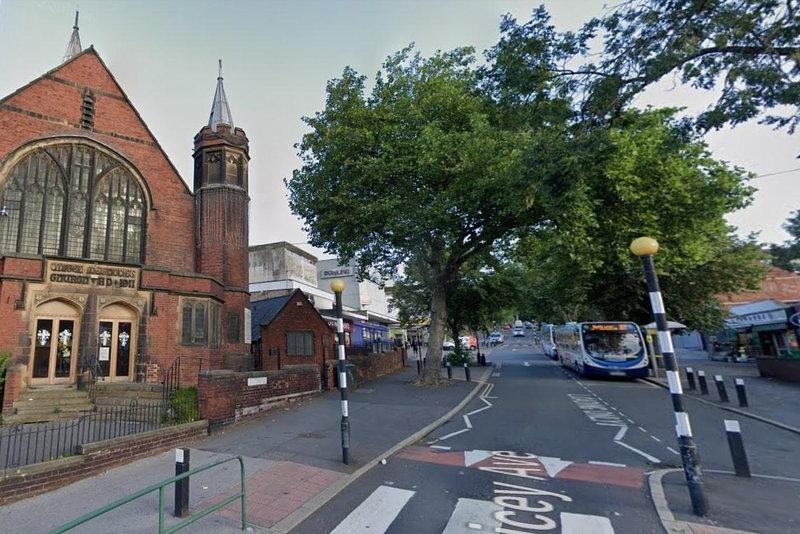
6. Firth Park
In the week to August 6 the infection rate was 590.2, up from 401.3 the week before. This is a rise of 47 per cent. Photo: Google Maps
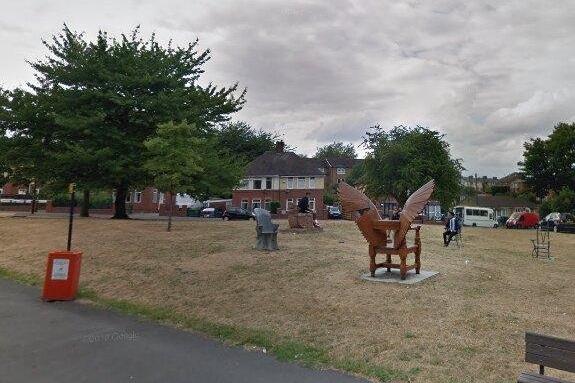
7. Brightside & Wincobank
In the week to August 6 the infection rate was 636.7, up from 434.6 the week before. This is a rise of 47 per cent. Photo: Google Maps
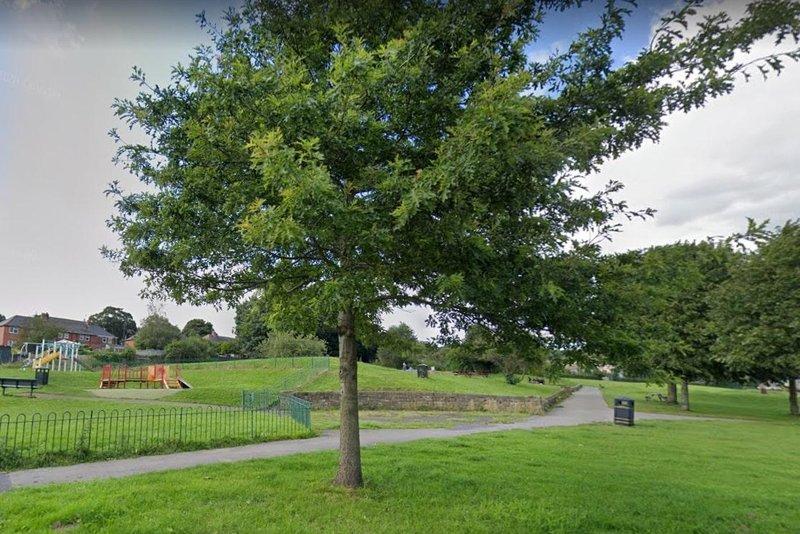
8. Grenoside & Ecclesfield North
In the week to August 6 the infection rate was 674.6, up from 458.2 the week before. This is a rise of 41 per cent. Photo: Google Maps