
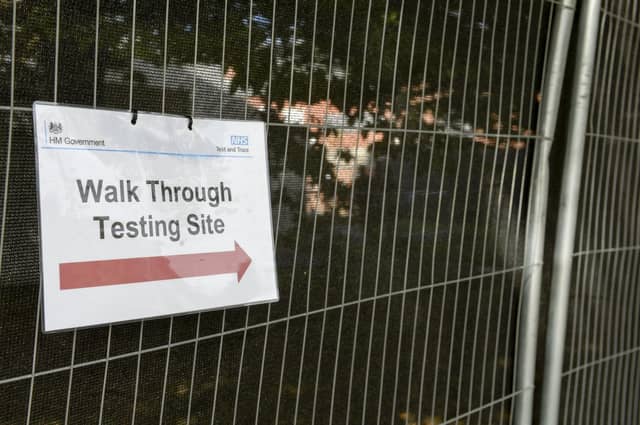

The city, which entered Tier 3 lockdown on Saturday along with the rest of South Yorkshire, has an overall weekly Covid-19 infection rate of 458.4 new cases per 100,000 people for the latest week, up from 421.3 for the previous week, but some areas are much worse affected than others.
Figures from Public Health England show the seven-day rolling rate of new cases up to October 23 for neighbourhoods within Sheffield – the latest date for which such information is available.
The seven–day rates are expressed per 100,000 population and are calculated by dividing the seven day count by the area population and multiplying by 100,000, the government health body has said.
These are the 12 areas of Sheffield where the infection rate is the highest based on these latest figures.
Images are used for illustrative purposes only and are not linked to the data in the article.
In these confusing and worrying times, local journalism is more vital than ever. Thanks to everyone who helps us ask the questions that matter by taking out a digital subscription or buying a paper. We stand together. Nancy Fielder, editor.
5. Darnall
The Darnall area of Sheffield had an average coronavirus rate of 690.6 new cases in every 100,000 people in the seven days to October 23. Photo: Google
6. Brincliffe and Sharrow Vale
The Brincliffe and Sharrow Vale area of Sheffield had an average coronavirus rate of 667.7 new cases in every 100,000 people in the seven days to October 23. Photo: Google
7. Crabtree and Fir Vale
The Crabtree and Fir Vale area of Sheffield had an average coronavirus rate of 657.6 new cases in every 100,000 people in the seven days to October 23. Photo: Google
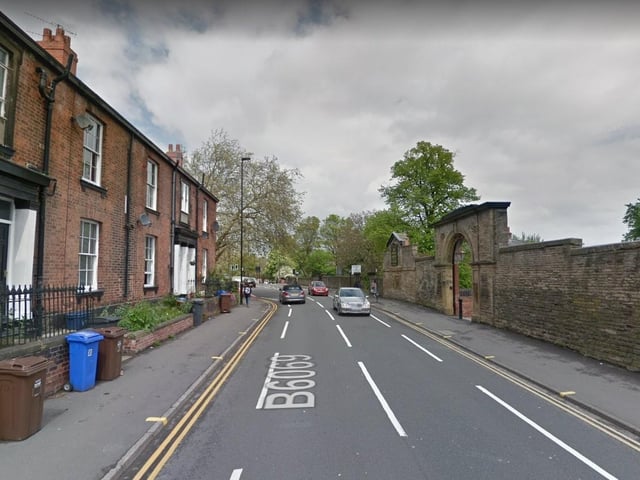
8. Broomhall
The Broomhall area of Sheffield had an average coronavirus rate of 654.7 new cases in every 100,000 people in the seven days to October 23. Photo: Google