Sheffield 14th in highest covid rates in England with cases rising
and live on Freeview channel 276
The figures, for the seven days to May 10, are based on the number of people who have tested positive for Covid-19 in either a lab-reported or rapid lateral flow test, by specimen date.
The rate is expressed as the number of new cases per 100,000 people.
Advertisement
Hide AdAdvertisement
Hide AdData for the most recent four days (May 11-14) has been excluded as it is incomplete and does not reflect the true number of cases.


Of the 315 local areas in England, 185 (59%) have seen a rise in rates, 119 (38%) have seen a fall and 11 are unchanged.
Sheffield recorded 300 cases in the seven days to May 10, the equivalent of 51.3 cases per 100,000 people a rise from 270 cases in the seven days to May 3; a rate of 46.2 per 100,000 people.
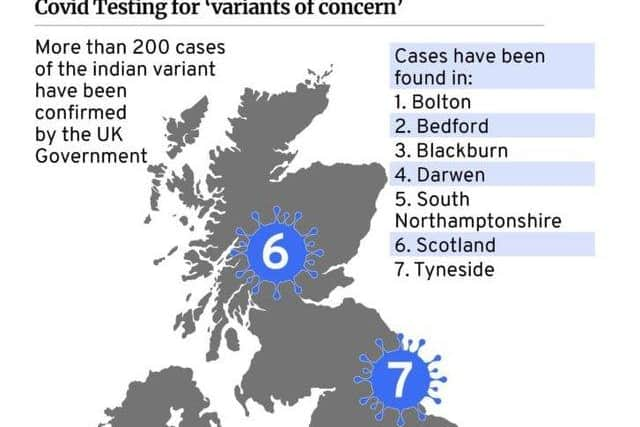
Bolton in Greater Manchester has the highest rate, with 657 new cases in the seven days to May 10 – the equivalent of 228.5 cases per 100,000 people.
This is up from 88.7 in the seven days to May 3.
Advertisement
Hide AdAdvertisement
Hide AdErewash in Derbyshire has the second highest rate, up from 88.4 to 163.0, with 188 new cases.
Blackburn with Darwen has the third highest, up from 56.8 to 111.6, with 167 new cases.
The five areas with the biggest week-on-week rises are:
Bolton (up from 88.7 to 228.5)
Erewash (88.4 to 163.0)
Bedford (42.7 to 105.0)
Blackburn with Darwen (56.8 to 111.6)
Melton (11.7 to 58.6)
The list has been calculated by the PA news agency based on Public Health England data published on May 14 on the Government’s coronavirus dashboard.
From left to right, it reads: name of local authority; rate of new cases in the seven days to May 10; number (in brackets) of new cases recorded in the seven days to May 10; rate of new cases in the seven days to May 3; number (in brackets) of new cases recorded in the seven days to May 3.
Bolton, 228.5, (657), 88.7, (255)
Erewash, 163.0, (188), 88.4, (102)
Blackburn with Darwen, 111.6, (167), 56.8, (85)
Bedford, 105.0, (182), 42.7, (74)
Selby, 69.5, (63), 55.2, (50)
Kirklees, 63.0, (277), 53.9, (237)
Melton, 58.6, (30), 11.7, (6)
Sefton, 56.8, (157), 26.0, (72)
Hounslow, 54.1, (147), 29.1, (79)
Wellingborough, 52.7, (42), 38.9, (31)
Middlesbrough, 52.5, (74), 28.4, (40)
Leeds, 52.4, (416), 44.6, (354)
North Lincolnshire, 52.2, (90), 54.6, (94)
Sheffield, 51.3, (300), 46.2, (270)
Corby, 51.2, (37), 33.2, (24)
Harborough, 51.2, (48), 27.7, (26)
Barnsley, 50.6, (125), 59.5, (147)
Rochdale, 49.9, (111), 35.1, (78)
Watford, 47.6, (46), 29.0, (28)
Burnley, 47.2, (42), 22.5, (20)
Leicester, 47.1, (167), 33.9, (120)
Wakefield, 47.1, (164), 56.0, (195)
Manchester, 46.1, (255), 34.9, (193)
Newcastle upon Tyne, 45.2, (137), 38.3, (116)
South Northamptonshire, 44.4, (42), 27.5, (26)
Bradford, 43.5, (235), 49.3, (266)
Hyndburn, 43.2, (35), 111.1, (90)
Ealing, 42.7, (146), 35.4, (121)
Doncaster, 42.6, (133), 55.1, (172)
South Holland, 42.1, (40), 54.7, (52)
Rotherham, 41.1, (109), 34.7, (92)
Hillingdon, 41.1, (126), 26.1, (80)