
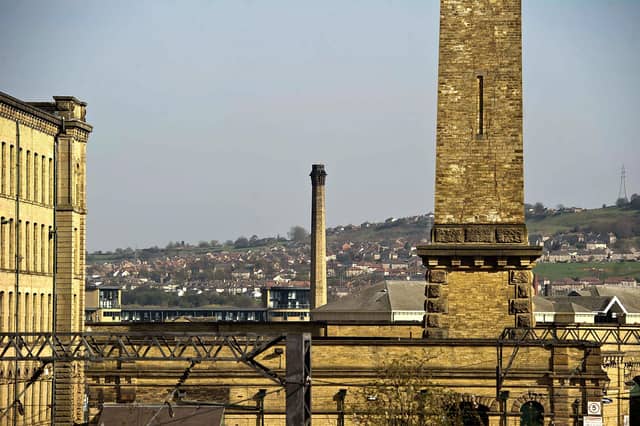

The number of new cases per 100,000 people in the city rose from 11.8 in the week ending July 17 to 17.2 in the seven days to Friday, July 24.
That meant Sheffield had the fourth highest coronavirus infection rate in Yorkshire for this period. The figures are based on tests carried out in laboratories and in the wider community. Data for the most recent three days (July 25-27) has been excluded as it is incomplete and likely to be revised.
The Star has broken down the weekly coronavirus rate of every local authority area in Yorkshire, listed in descending order, so you can see how different areas compare.
Pictures are for illustrative purposes only.
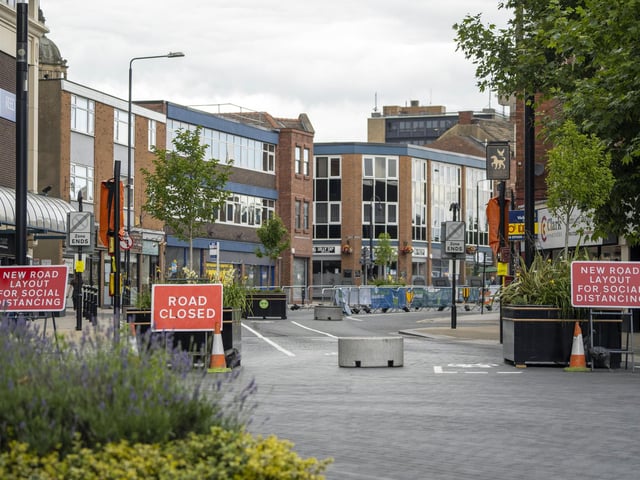
5. WAKEFIELD
Wakefield had a rate of 13.9 in the seven days to July 24, down from 20.6 for the previous seven days to July 17. Photo: Scott Merrylees
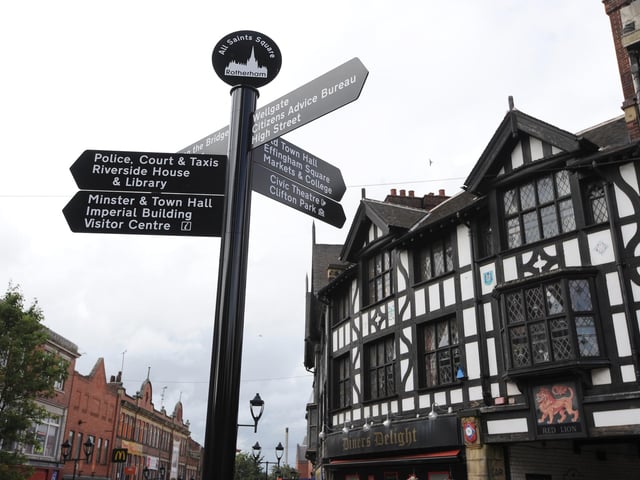
6. ROTHERHAM
Rotherham had a rate of 12.5 in the seven days to July 24, down from 26.1 for the previous seven days to July 17. Photo: Anna Gowthorpe
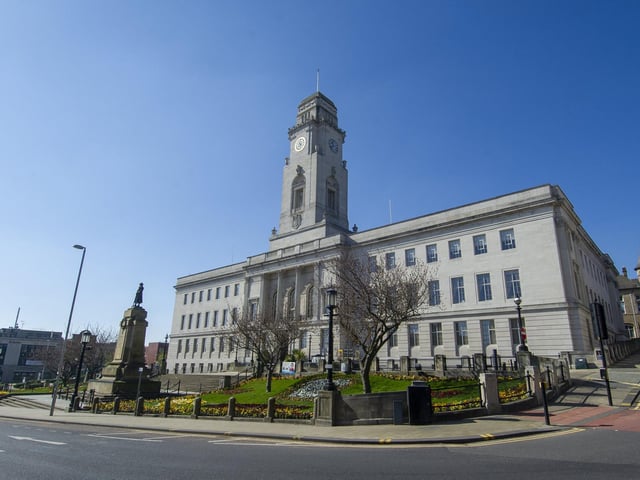
7. BARNSLEY
Barnsley had a rate of 11.4 in the seven days to July 24, up from 10.2 for the previous seven days. Photo: Yorkshire Post Newspapers
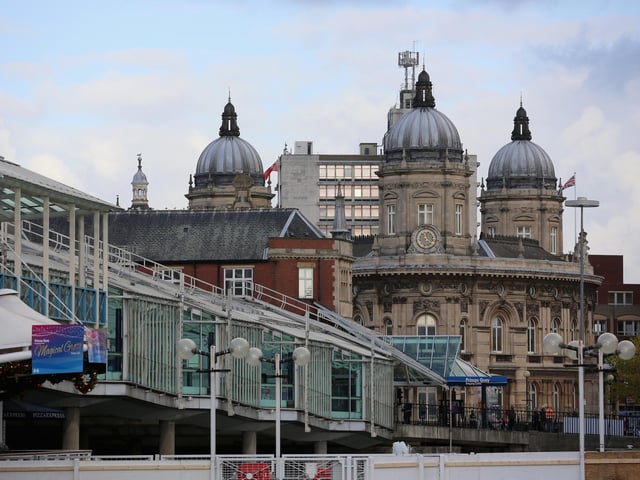
8. HULL
Hull had a rate of 6.1 in the seven days to July 24, up from 3.5 for the previous week. Photo: Christopher Furlong