
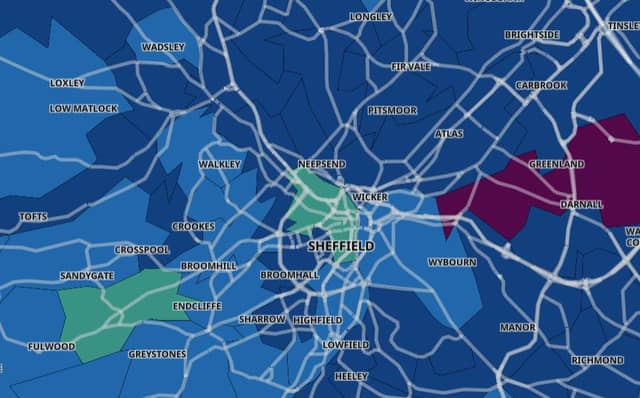

The city’s Covid infection rate has fallen since the latest national lockdown began on January 6, according to Government figures.
But since mid-January the rate of positive Covid cases per 100,000 people in Sheffield has risen in more neighbourhoods than it has fallen, the latest statistics show.
While 30 out of 70 neighbourhoods across Sheffield have seen a drop in infections, the number of cases has risen in 36, with no change in the other four.
Here we reveal which neighbourhoods have seen the biggest drop in case rates per 100,000 between January 14 and 21.
Images are for illustrative purposes only.
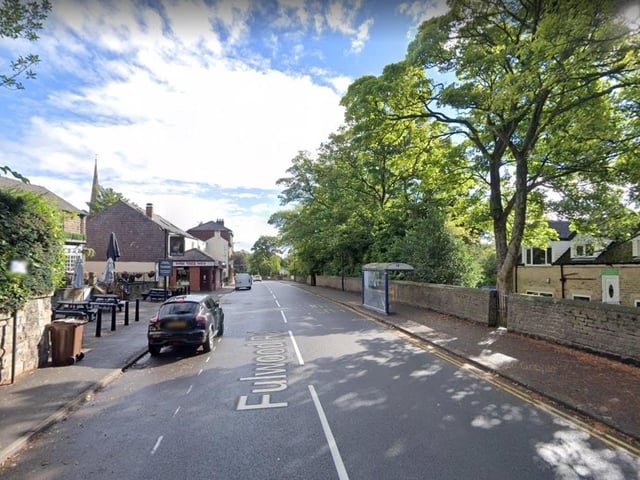
9. Endcliffe and Ranmoor
Endcliffe and Ranmoor has seen its weekly rate of positive Covid cases fall by 36%, from 109.0 cases per 100,000 on January 14 to 69.4 on January 21 Photo: Google
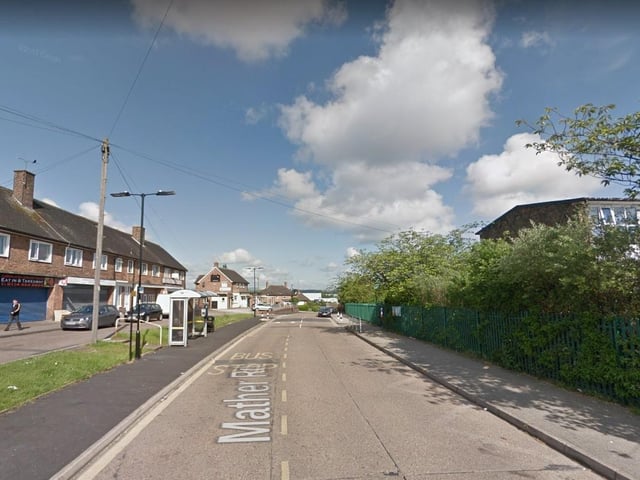
10. Littledale and Handsworth
Littledale and Handsworth has seen its weekly rate of positive Covid cases fall by 32%, from 330.2 cases per 100,000 on January 14 to 223.3 on January 21 Photo: Google
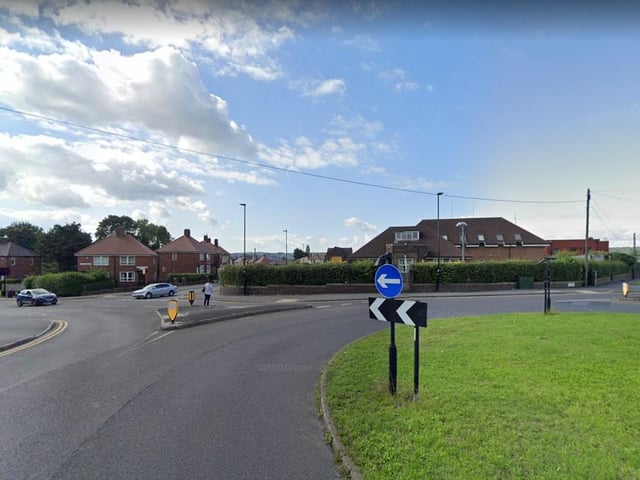
11. Southey Green East
Southey Green East has seen its weekly rate of positive Covid cases fall by 32%, from 318.2 cases per 100,000 on January 14 to 216.4 on January 21 Photo: Google
12. Woodhouse West
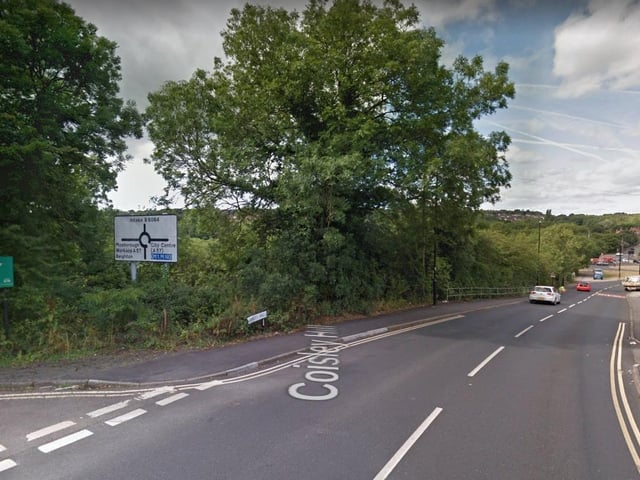
Woodhouse West has seen its weekly rate of positive Covid cases fall by 32%, from 315.6 cases per 100,000 on January 14 to 215.9 on January 21 Photo: Google