
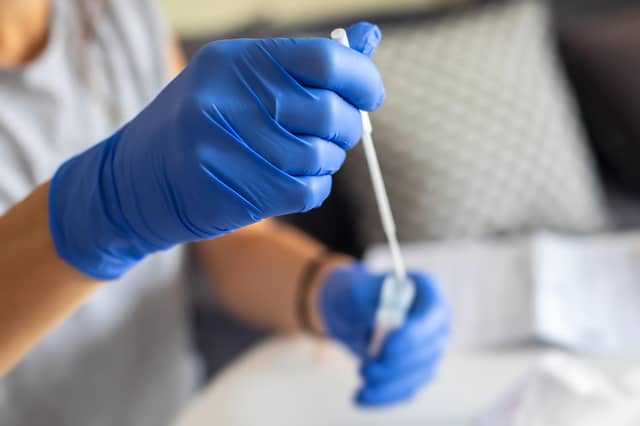


There were 410,173 positive Covid-19 cases in the UK during the week ending March 10 – a 56 per cent rise from the week before.
In Sheffield, out of the city’s 71 neighbourhoods where data is recorded, all but five have seen a rise in case rates.
Below are the Sheffield neighbourhoods where the rates of cases per 100,000 people are highest, and how much they have gone up by between March 3 and 10.
The increase comes as the latest figures show the number of patients with Covid in Sheffield’s hospitals has risen significantly for the first time since mid-January as the new ‘stealth Omicron’ BA.2 strain spreads.
From March 4 to 8, the number of patients with the disease increased from 72 to 88.
The number of Covid patients being treated by Sheffield Teaching Hospitals remains well below the level recorded earlier this year, when it peaked at 293 on January 17.
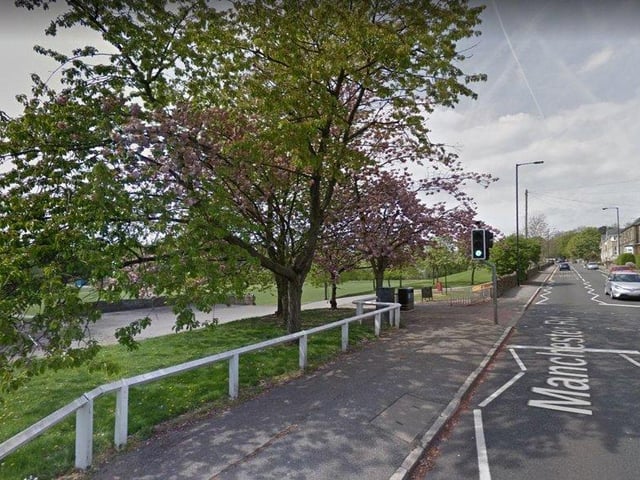
5. Sandygate and Crosspool
Sandygate and Crosspool had 602.8 Covid-19 cases per 100,000 people in the latest week, a rise of 153.4% from the week before. Photo: Google
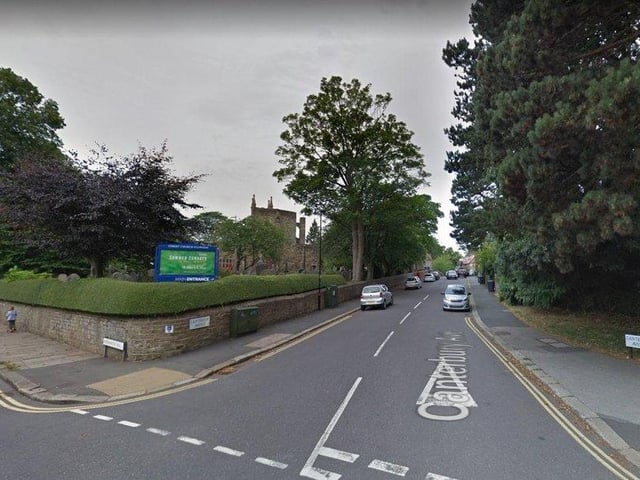
6. Fulwood and Lodge Moor
Fulwood and Lodge Moor had 599.4 Covid-19 cases per 100,000 people in the latest week, a rise of 95.8% from the week before. Photo: Google
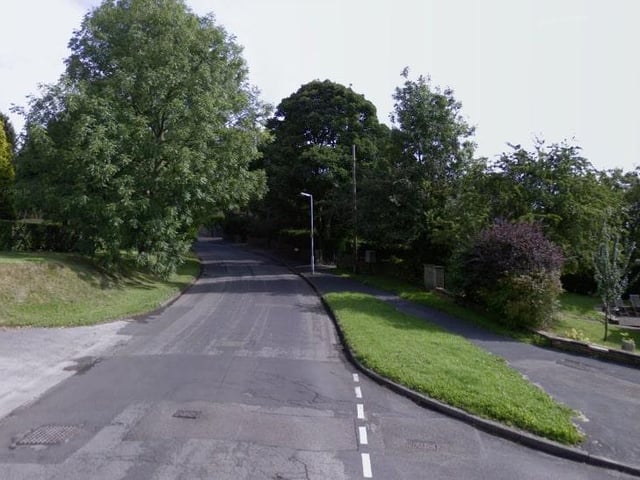
7. Dore and Whirlow
Dore and Whirlow had 578.9 Covid-19 cases per 100,000 people in the latest week, a rise of 81.8% from the week before. Photo: Google
8. Wadsley and Marlcliffe
Wadsley and Marlcliffe had 572 Covid-19 cases per 100,000 people in the latest week, a rise of 120% from the week before. Photo: Google