

There were 3,449 new confirmed cases of Covid-19 recorded across the city during the week ending March 16, the latest date for which figures are available.
That’s a rate of 585.4 new coronavirus cases per 100,000 people, which is significantly below the UK-wide rate of 831.8.
The case rate rose in all but two out of 70 neighbourhoods across Sheffield for which statistics are published.
Only in Firth Park did the rate fall, while it was unchanged in Tinsley and Carbrook.
Which areas in Sheffield have the highest Covid case rates
The biggest weekly increase was 286.7 per cent in Littledale and Handsworth North.
The highest case rate in Sheffield was 1534.7 in Beauchief, followed by 1317.6 in Ecclesall and Greystones, and 1209.8 in Bents Green and Millhouses.
HEALTH: Covid patients in Sheffield's hospitals up by nearly a quarter, as 'stealth Omicron' strain spreads
Below are the areas of Sheffield where the Covid case rate rose fastest during the latest week.
Photos are for illustrative purposes only.
The case rate rose in all but two out of 70 neighbourhoods across Sheffield for which statistics are published.
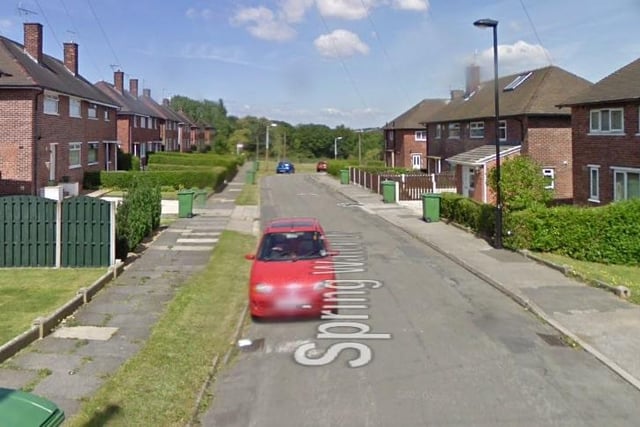
5. Birley
In the Sheffield neighbourhood of Birley, the Covid case rate rose by 172 per cent, from 25 cases during the week ending March 9 to 68 during the week ending March 16 - a rate of 618 confirmed cases per 100,000 people Photo: Google
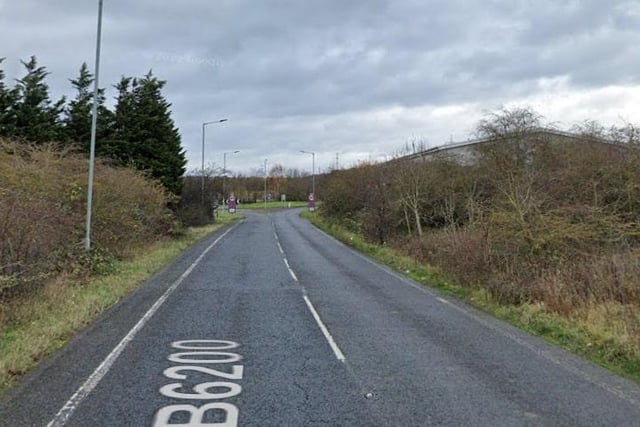
6. Woodhouse Mill
In the Sheffield neighbourhood of Woodhouse Mill, the Covid case rate rose by 170 per cent, from 20 cases during the week ending March 9 to 54 during the week ending March 16 - a rate of 858.8 confirmed cases per 100,000 people Photo: Google
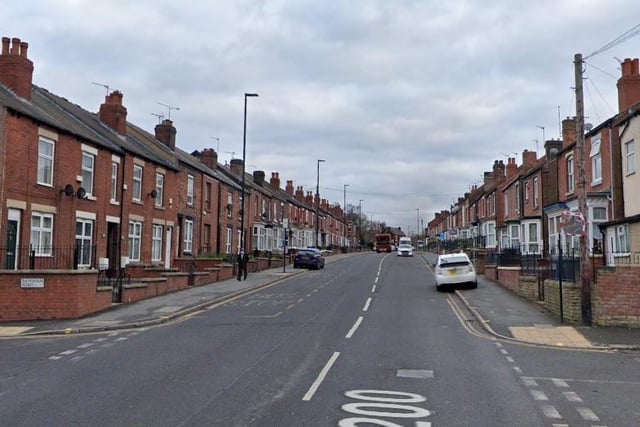
7. Darnall
In the Sheffield neighbourhood of Darnall, the Covid case rate rose by 162.5 per cent, from 8 cases during the week ending March 9 to 21 during the week ending March 16 - a rate of 243.7 confirmed cases per 100,000 people Photo: Google Maps
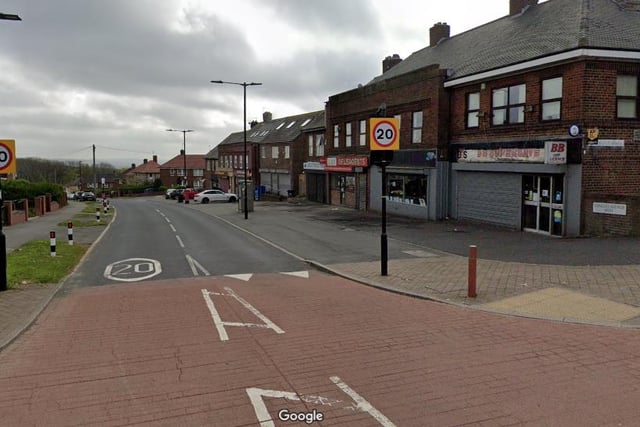
8. Shirecliffe & Parkwood Springs
In the Sheffield neighbourhood of Shirecliffe & Parkwood Springs, the Covid case rate rose by 150 per cent, from 4 cases during the week ending March 9 to 10 during the week ending March 16 - a rate of 143.1 confirmed cases per 100,000 people Photo: Submitted