
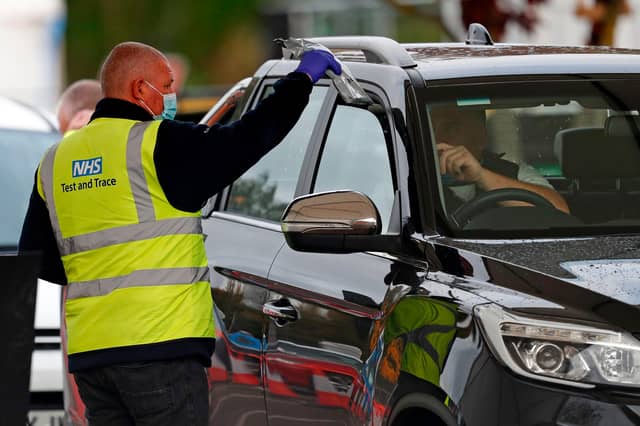

After almost seven long weeks of national lockdown, Boris Johnson is preparing to unveil a roadmap to open up the economy again.
Covid cases have plummeted across England since lockdown was imposed on 31 December, from 557.9 cases per 100,000 to 148.8 in the seven days to 11 February.
But there are still 467 neighbourhoods across the country where infection rates are higher than they were on 31 December, the day lockdown came into force – and 10 of them are in Sheffield.
Here are the areas where Covid cases in the seven days to 11 February were higher than in the last week of December.
Images are used for illustrative purposes only and are not linked to data in the article.
In these confusing and worrying times, local journalism is more vital than ever. Thanks to everyone who helps us ask the questions that matter by taking out a digital subscription or buying a paper. We stand together. Nancy Fielder, editor.
- RELATED: "Strokely Come Dancing" returns to Sheffield after 10 years
- RELATED: Why Sheffield fruit fly population is surging in autumn - and what to do about them
- RELATED: Tiny white flies swarm Sheffield - this is why
- RELATED: 'Is Andy Burnham's dream of decent care for elderly so terrifying?' - Nancy Fielder
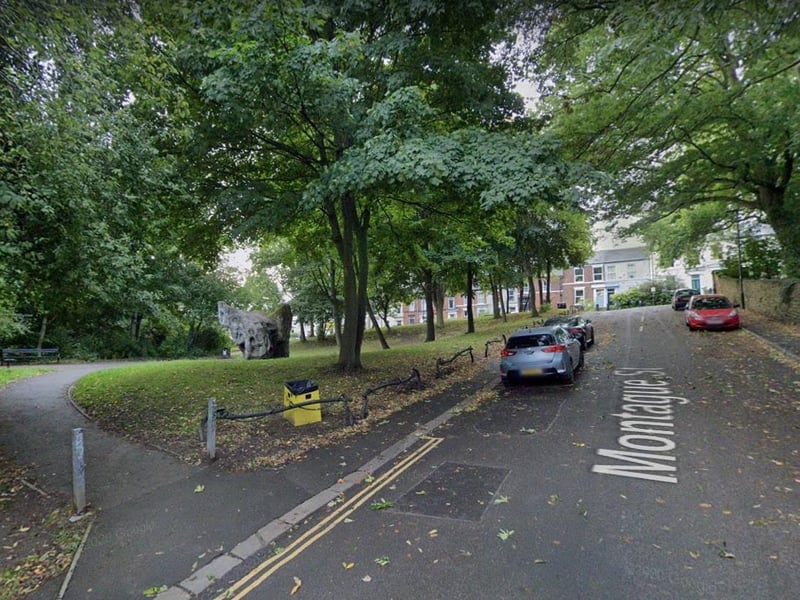
5. Sharrow
Sharrow now has 156 cases per 100,000 people, 14% more than in the week to 31 December, when there were 136.5. Photo: Google
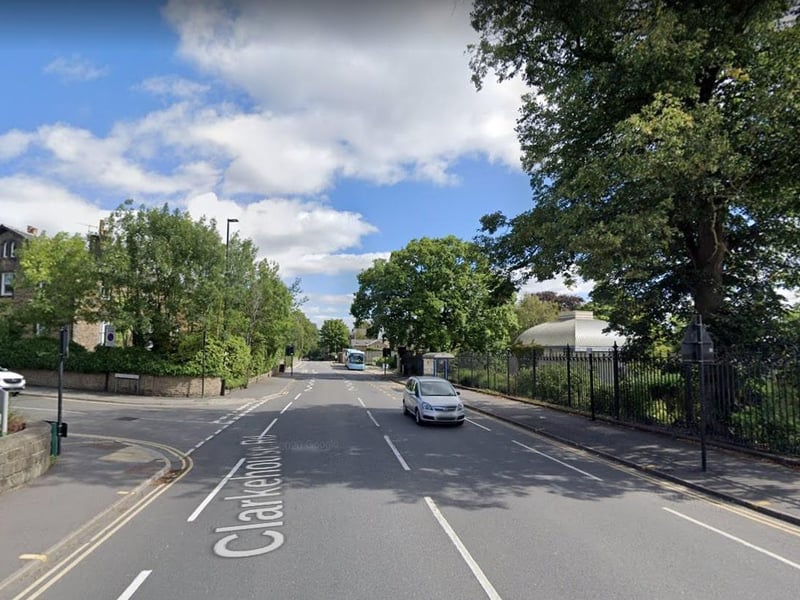
6. Broomhall
Broomhall now has 109.1 cases per 100,000 people, 11% more than in the week to 31 December, when there were 98.2. Photo: Google
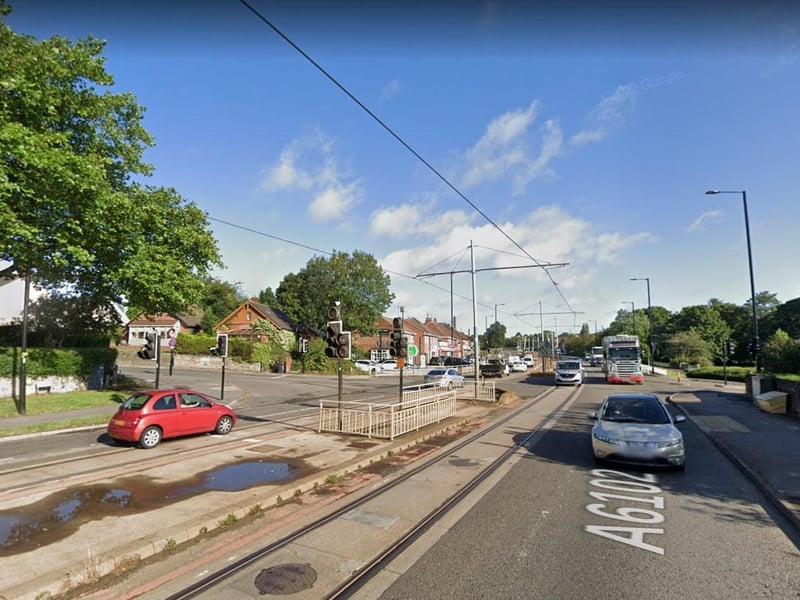
7. Gleadless
Gleadless now has 172.8 cases per 100,000 people, 10% more than in the week to 31 December, when there were 157.1. Photo: Google
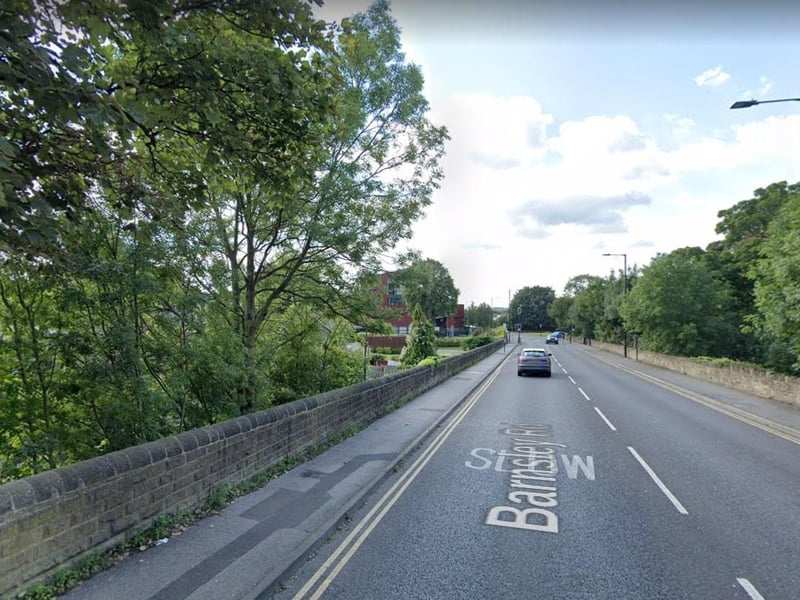
8. Sheffield Lane Top and Longley Park
Sheffield Lane Top and Longley Park now has 362.8 cases per 100,000 people, 10% more than in the week to 31 December, when there were 329.8. Photo: Google