
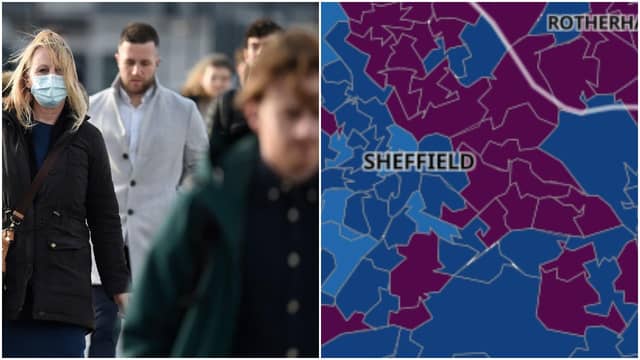

The figures, from Public Health England, show data collected from November 1-7 and are available to view in an interactive map.
This week Sheffield’s director for public health, Greg Fell, said the number of new Covid-19 cases was falling- but not low enough.
Mr Fell said: “The numbers of new cases per week are settling and actually going down at the moment.
"However, they are settling at a much higher rate than we saw in the summer, and far too high for comfort.
“There has been a significant increase in the number of deaths, sadly, and there will be more to come – there is nothing we can do about that now – but, again, that will slow.”
Please note the images used for illustrative purposes and not linked to the data.
In these confusing and worrying times, local journalism is more vital than ever. Thanks to everyone who helps us ask the questions that matter by taking out a digital subscription or buying a paper. We stand together. Nancy Fielder, editor.
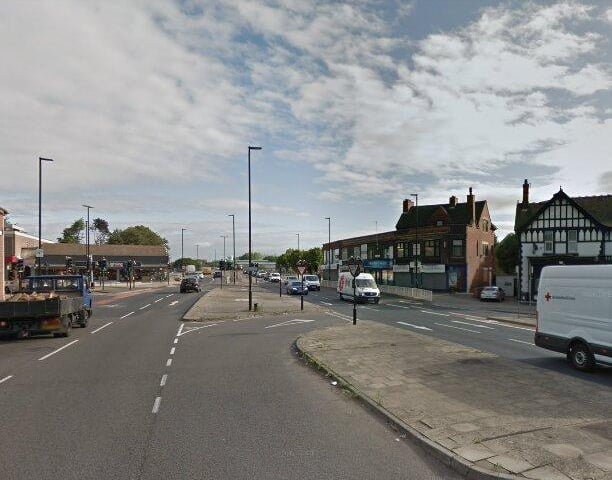
1. DARNALL- 37 NEW CASES
Darnall has seen the biggest rise in new cases- a total of 37, bringing the total recorded cases in the area between November 1-7 to 66. Photo: Google Maps
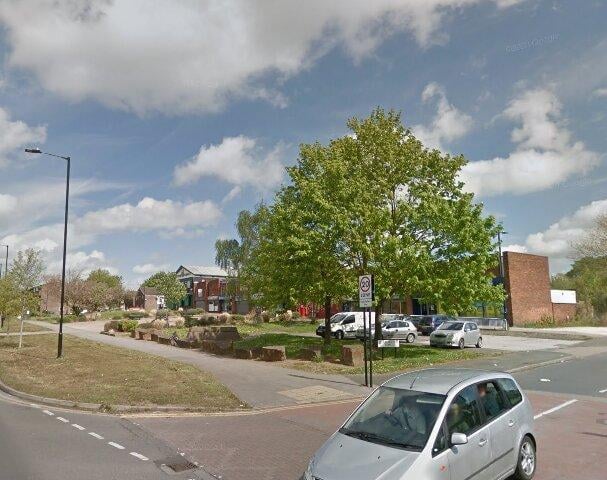
2. TINSLEY AND CARBROOK- 27 NEW CASES
In this area, the total recorded Covid-19 cases between November 1-7 was 46 after 27 new cases were confirmed. Photo: Google Maps
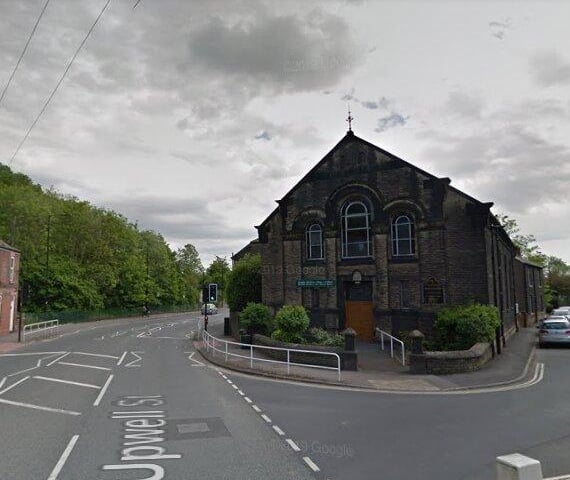
3. BURNGREAVE AND GRIMESTHORPE- 24 NEW CASES
A total of 75 cases of the virus were recorded here between November 1-5 after 24 new cases were confirmed in the area. Photo: Google Maps
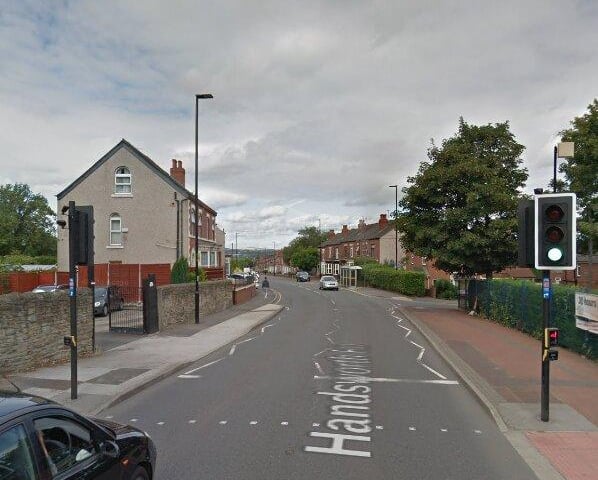
4. HANDSWORTH NORTH AND LITTLEDALE- 19 NEW CASES
19 new cases have been recorded in this area, taking to the total to 69 cases between November 1-7. Photo: Google Maps